


Content
Wazuh Docker deployment
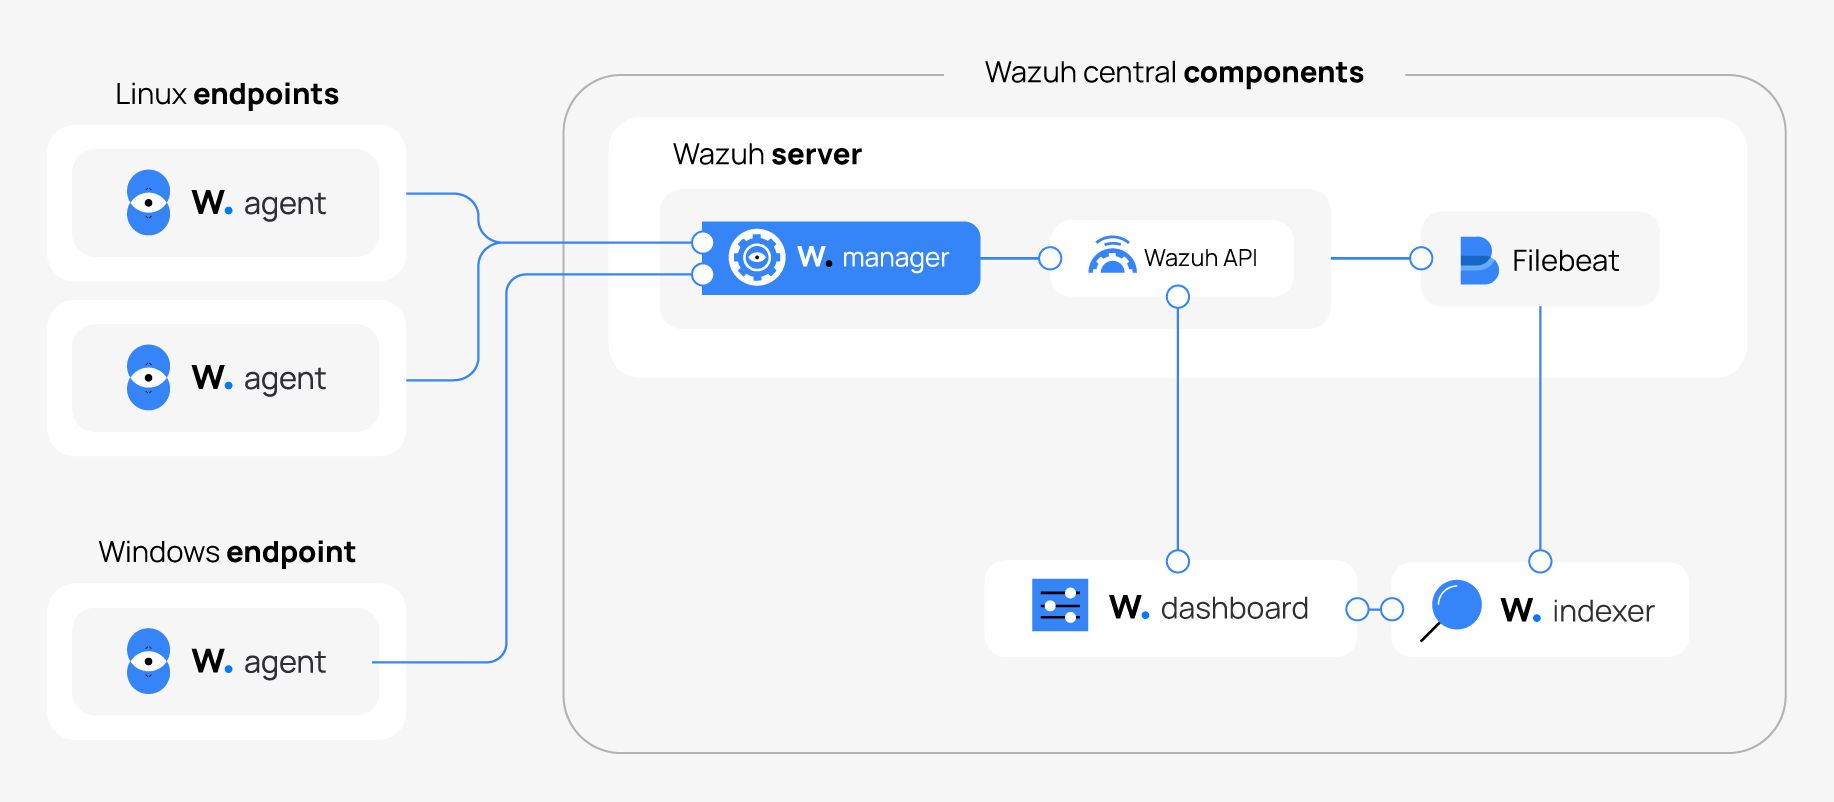
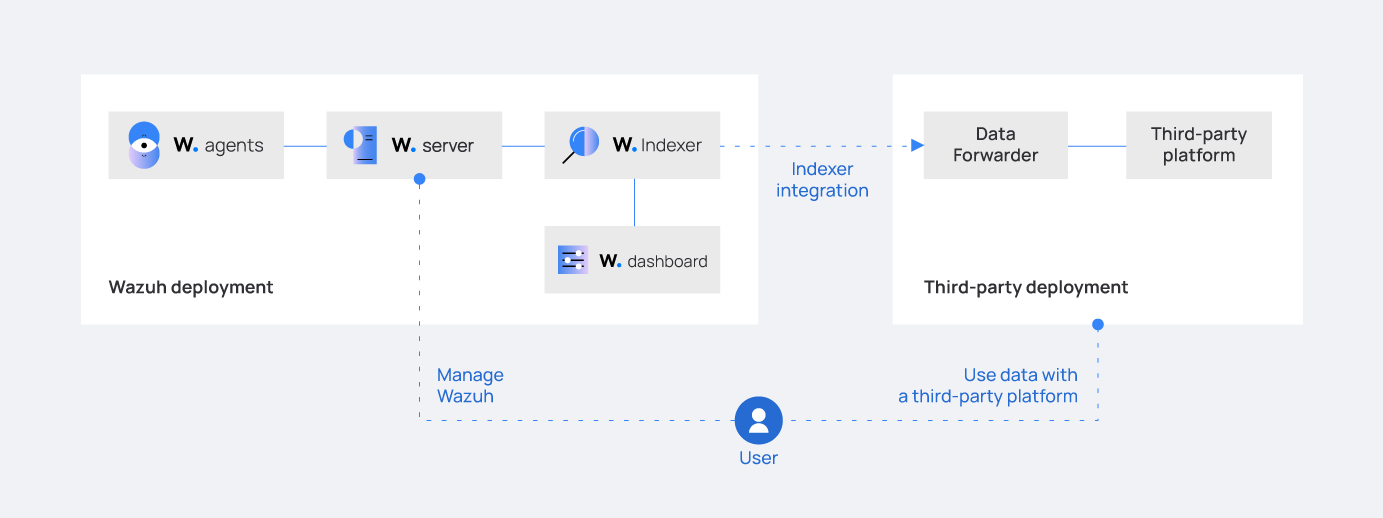
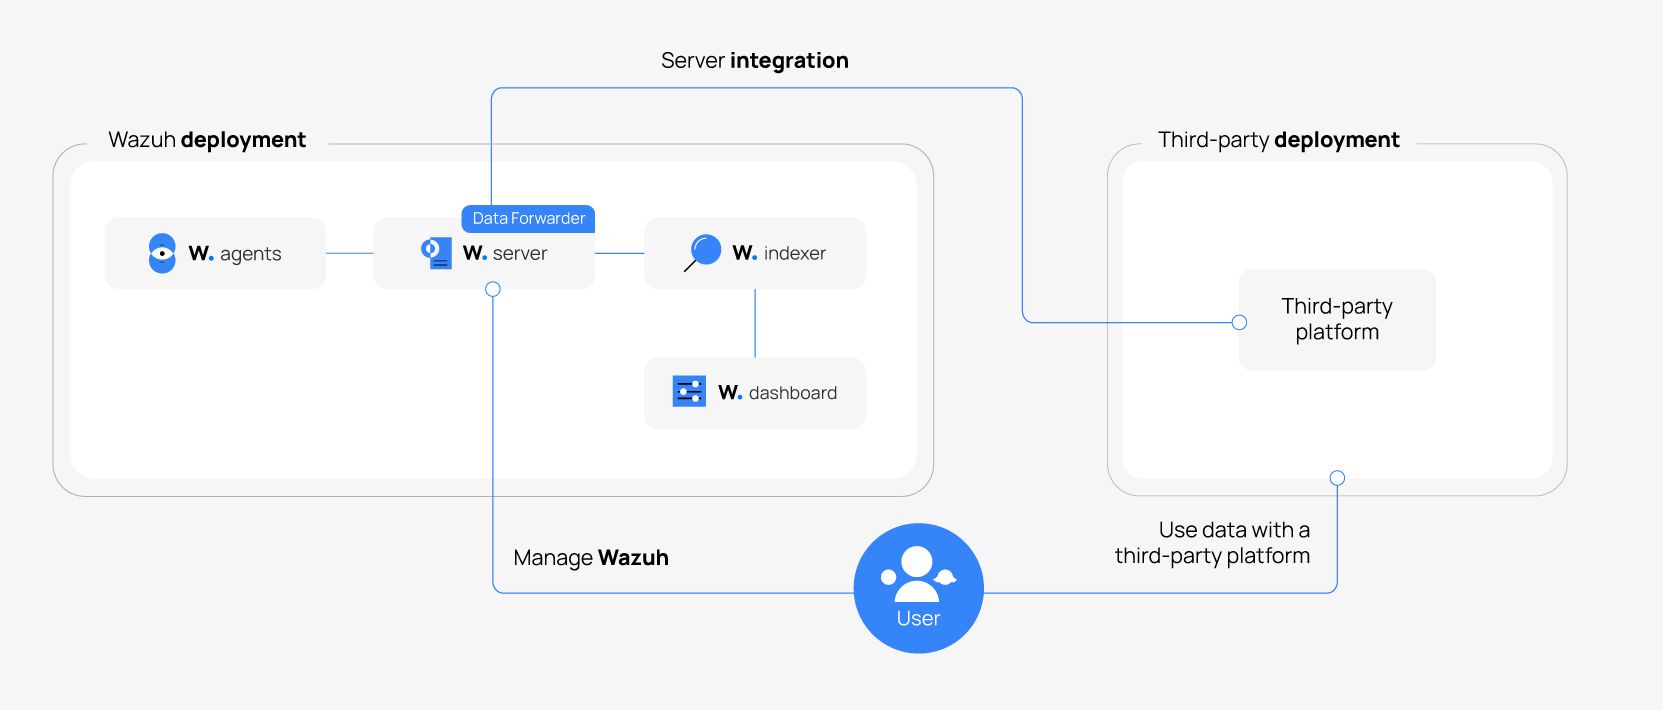
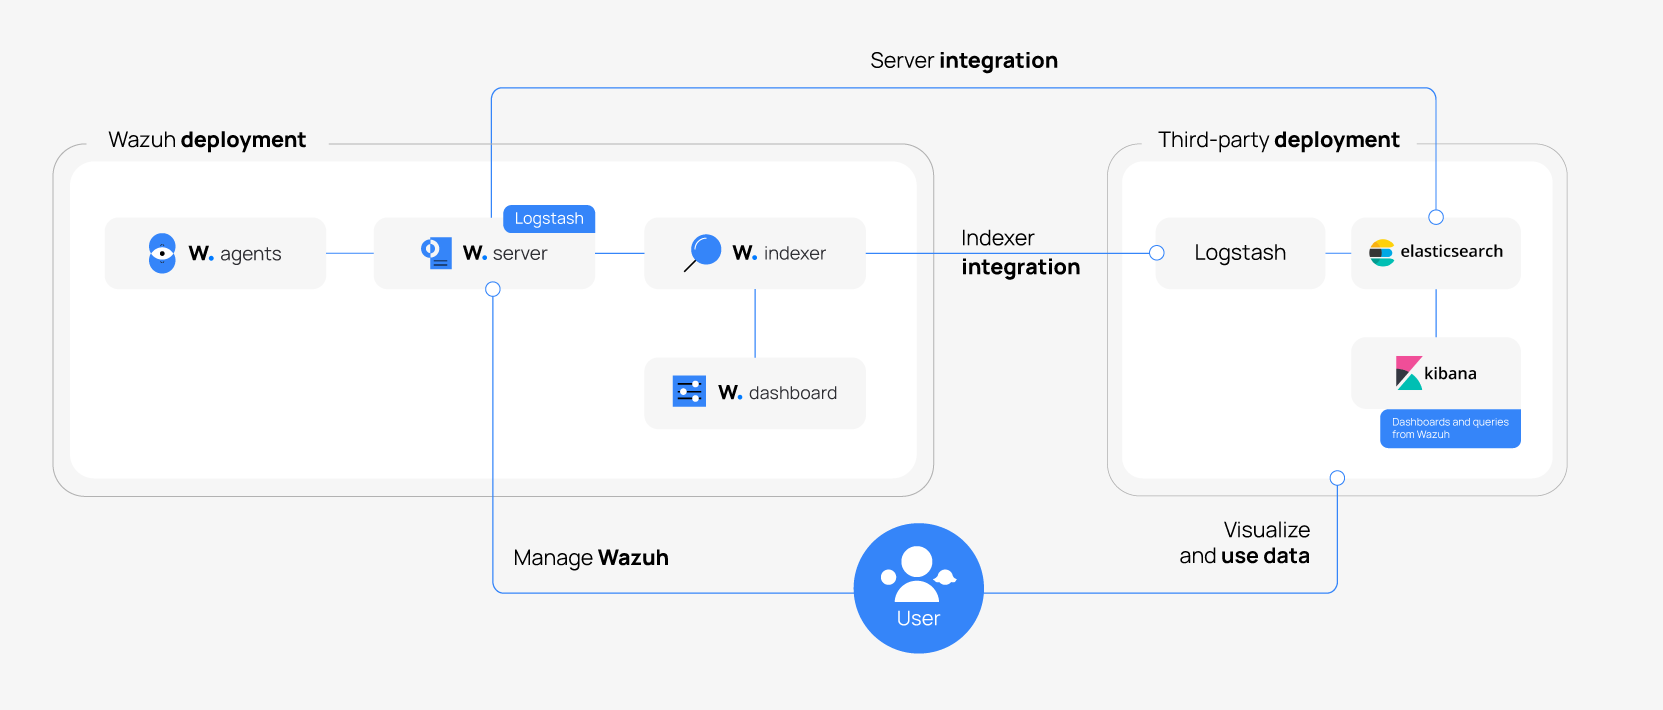
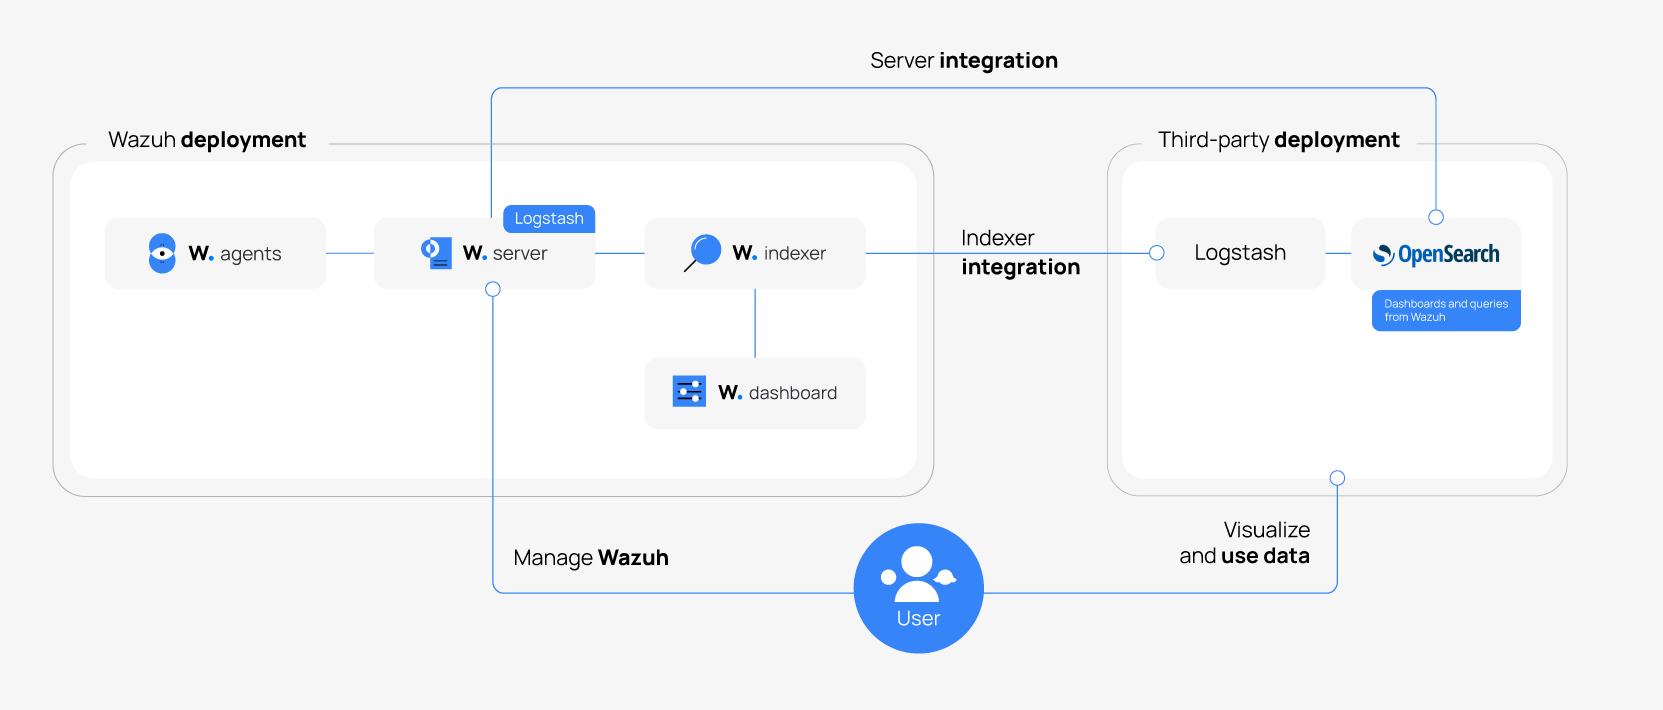
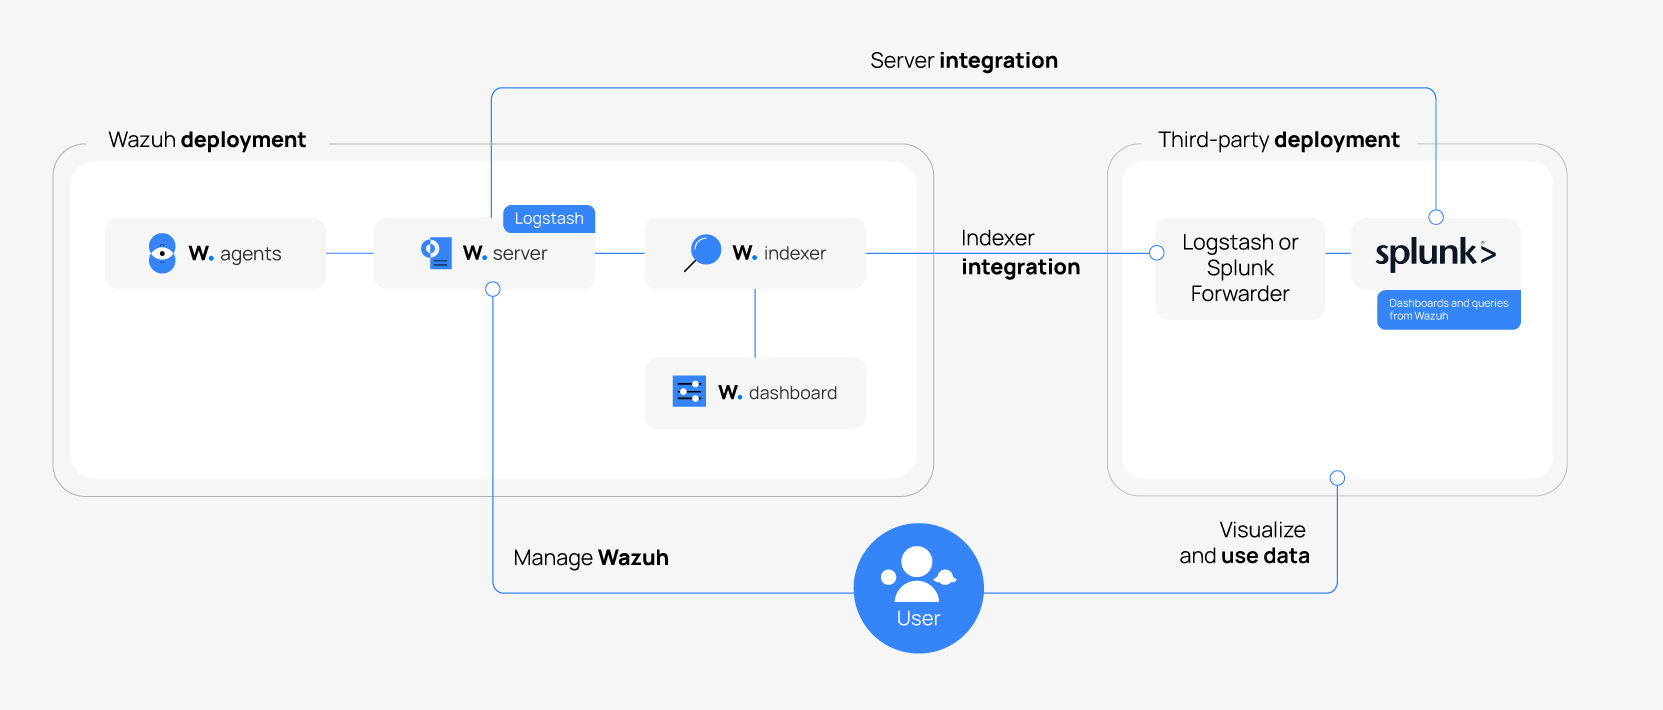
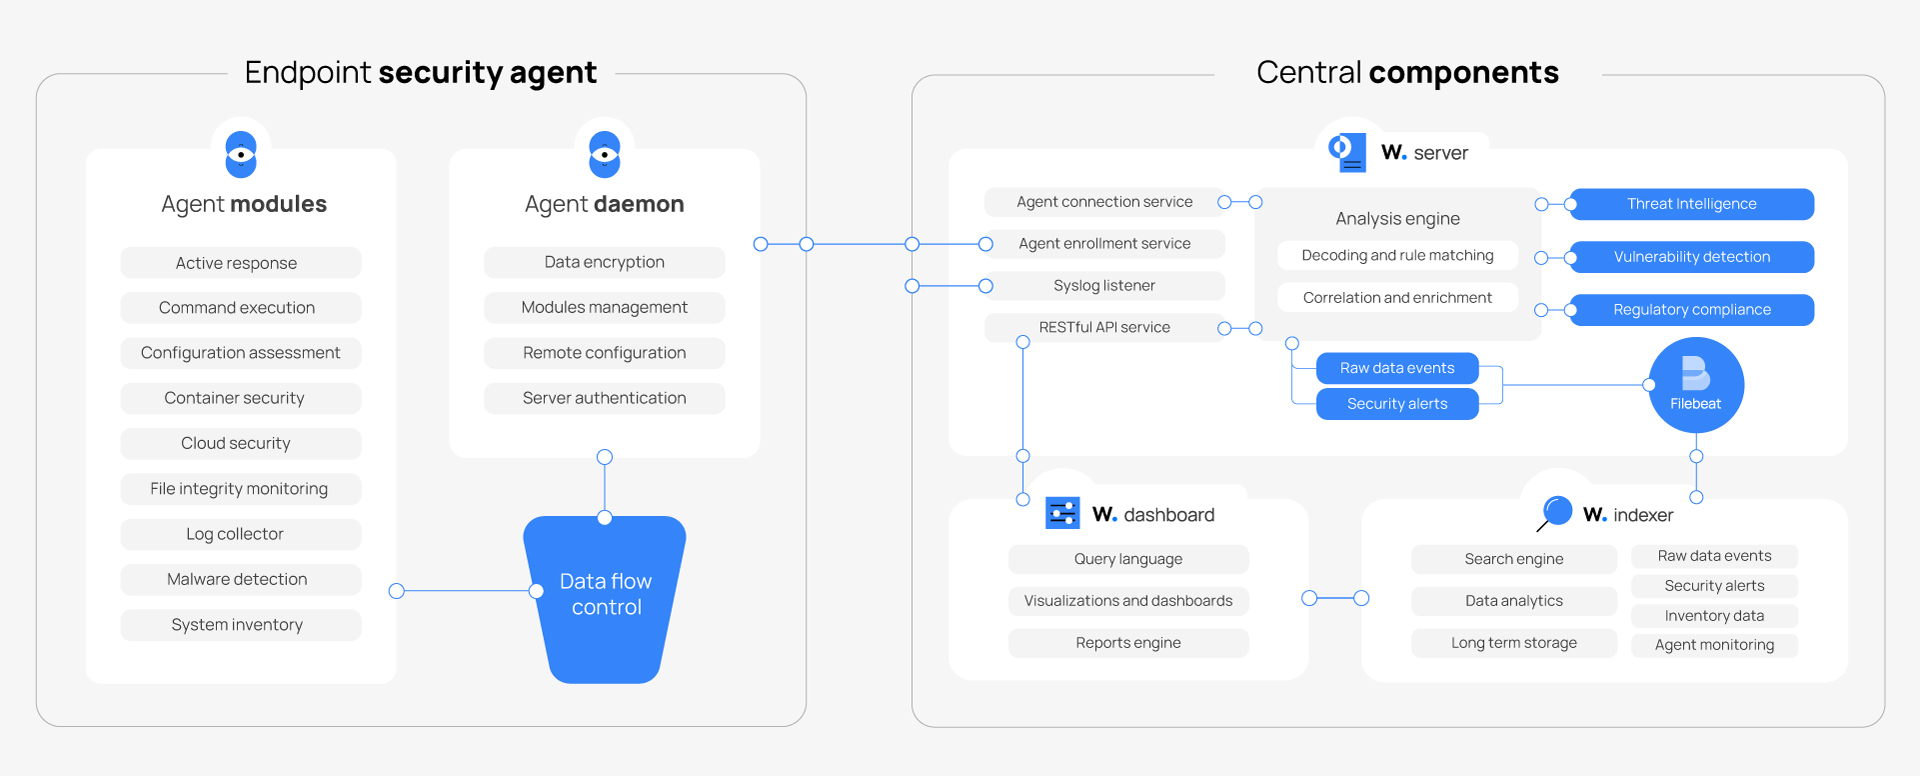
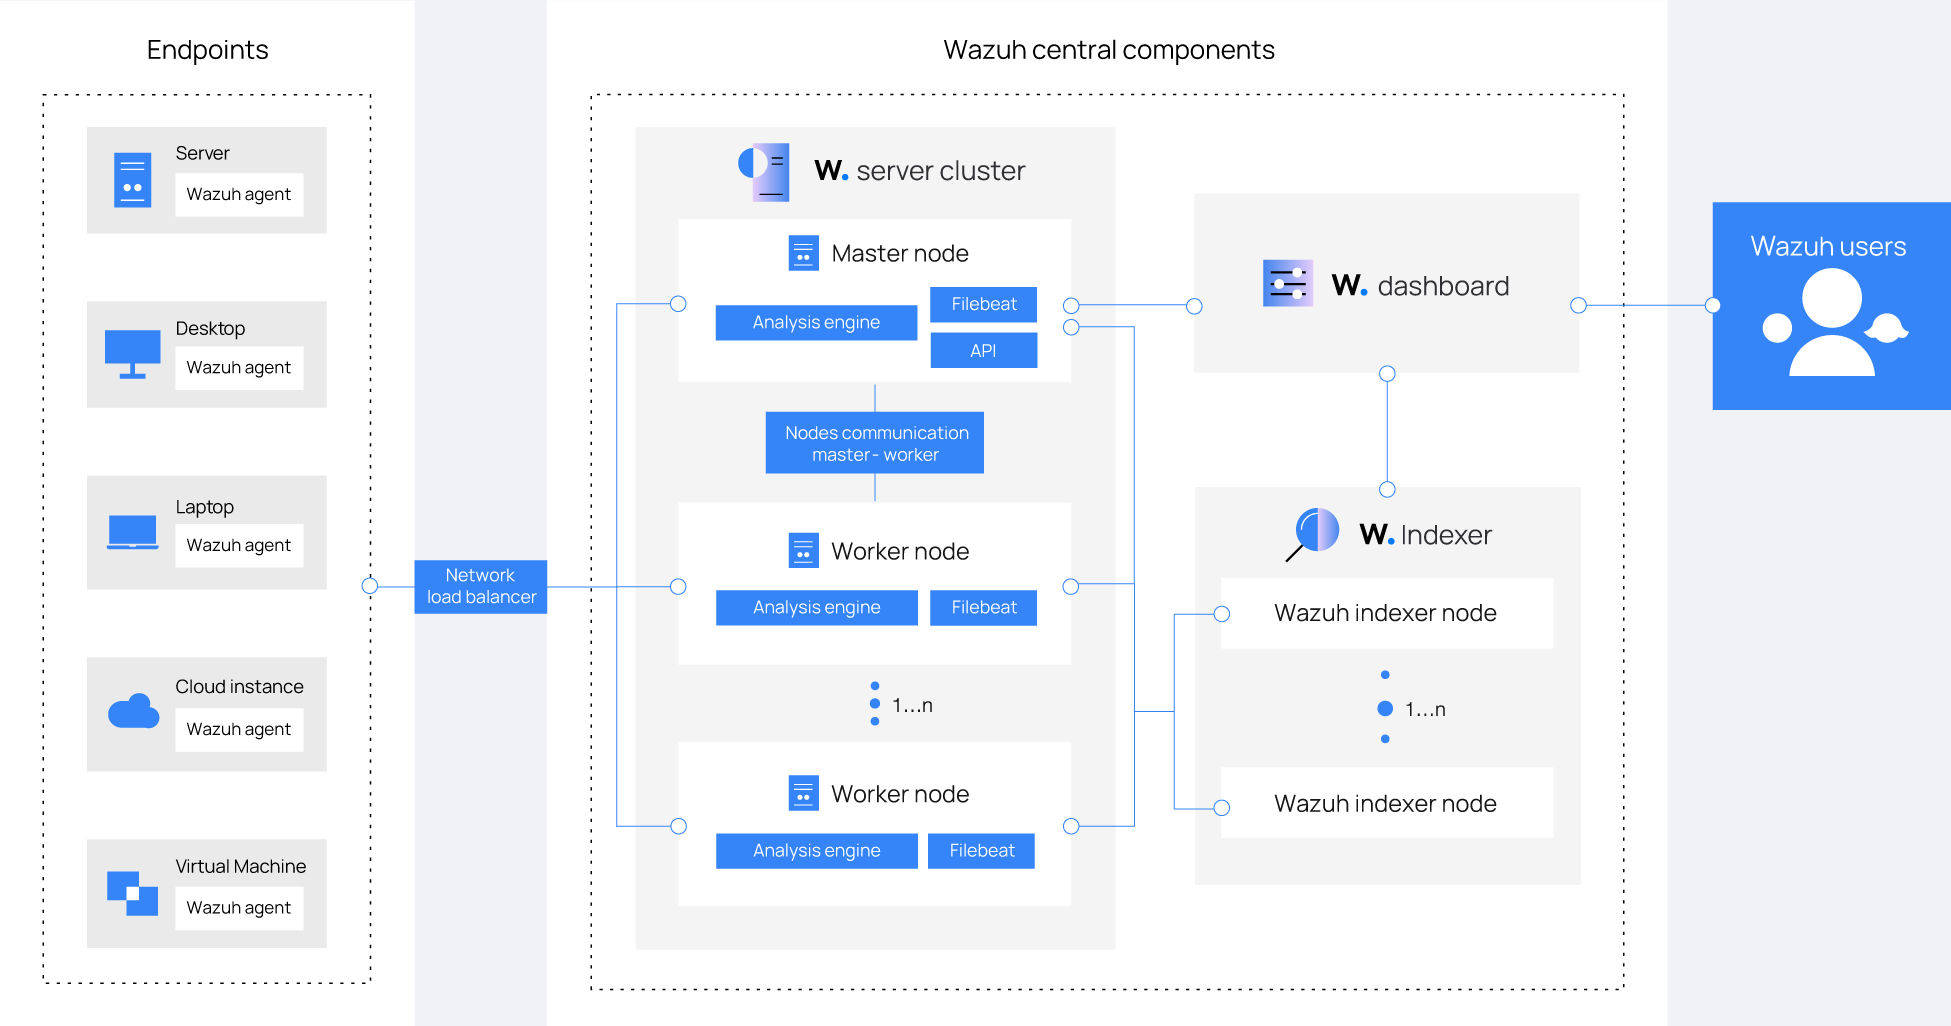
Wazuh consists of a multi-platform Wazuh agent and three central components: the Wazuh server, the Wazuh indexer, and the Wazuh dashboard. Refer to the Wazuh components documentation for more information.
Deployment options
Wazuh supports the deployment of its central components and agent on Docker.
Single-node stack: This stack deploys one of each Wazuh central component as a separate container. It includes:
Wazuh indexer container: Stores and indexes security data collected by the Wazuh manager.
Wazuh manager container: Analyzes collected security events, applies detection rules, and manages Wazuh agents.
Wazuh dashboard container: Centralized web interface for monitoring, searching, and managing Wazuh.
It provides persistent storage and configurable certificates for secure communication.
Multi-node stack: This stack deploys each Wazuh component as a separate container. It includes:
Three Wazuh indexer containers: Work together in a cluster to store and replicate indexed data, ensuring scalability and fault tolerance.
Two Wazuh manager containers: One master and one worker node. The master coordinates agent management and rule updates, while the worker provides redundancy and load distribution.
One Wazuh dashboard container.
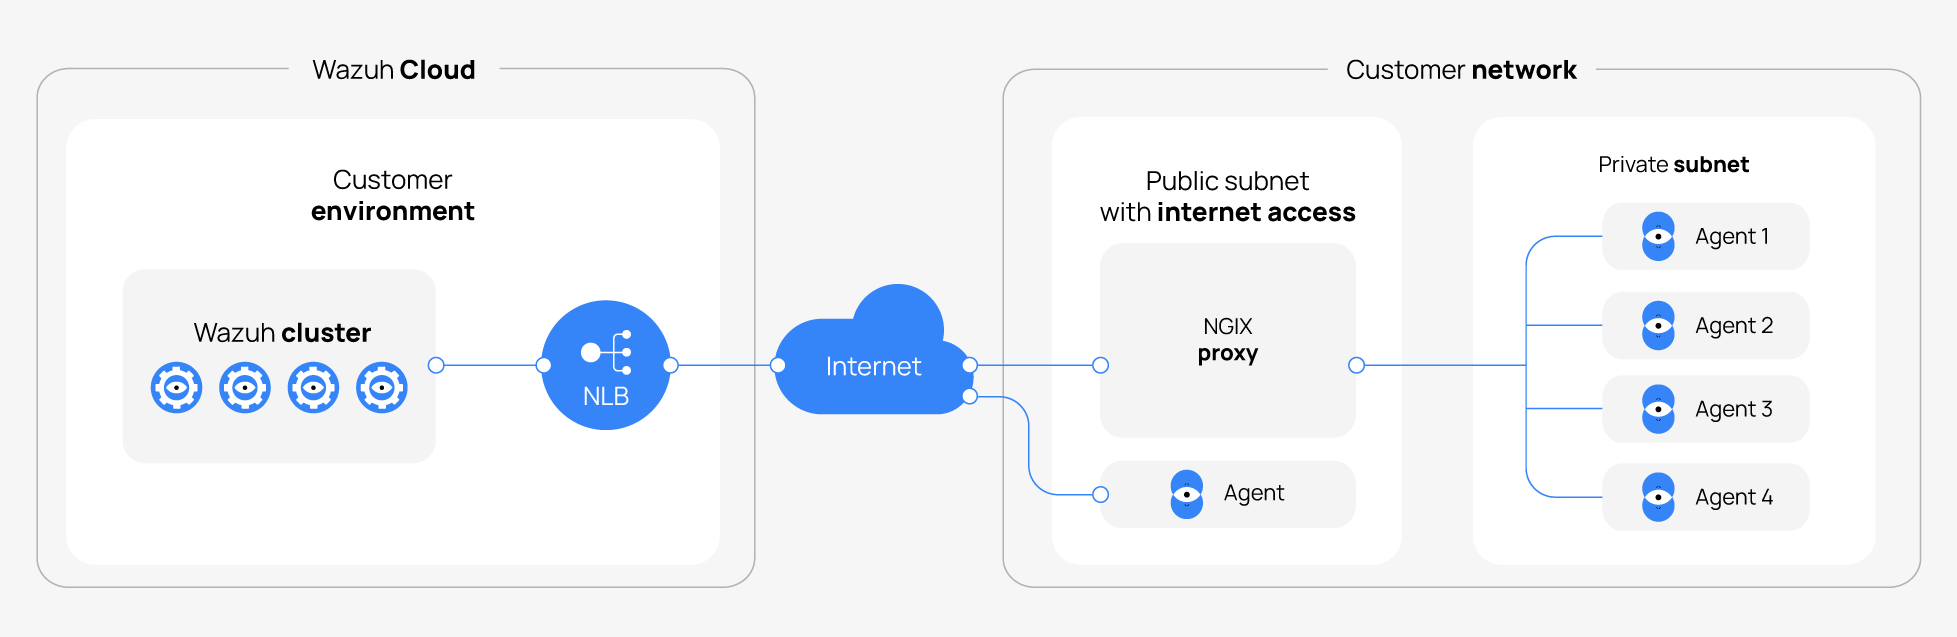
One Nginx proxy container: This provides a single secure entry point that load balances traffic between multiple Wazuh manager nodes for high availability. The Nginx container acts as a reverse proxy, distributing incoming requests across the available manager nodes and providing SSL termination for secure communication.
This deployment stack provides persistent storage, secure communication, and high availability.
Wazuh agent: This deploys the Wazuh agent as a container on your Docker host.
Prerequisites
Before deploying Wazuh on Docker, ensure your environment meets the following requirements.
System requirements
Single-node stack deployment
Operating system: Linux or Windows
Architecture: AMD64 (x86_64) or ARM64 (AARCH64)
CPU: At least 4 cores
Memory: At least 8 GB of RAM for the Docker host
Disk space: At least 50 GB storage for Docker images and data volumes
Multi-node stack deployment
Operating system: Linux or Windows
Architecture: AMD64 or ARM64
CPU: At least 4 cores
Memory: At least 16 GB for the Docker host
Disk space: At least 100 GB storage for Docker images and data volumes
Wazuh agent deployment
Operating system: Linux or Windows
Architecture: AMD64
CPU: At least 2 cores
Memory: At least 1 GB of RAM for the Docker host
Disk space: At least 10 GB storage for Docker images and logs
Required software
Docker Engine / Docker Desktop: Use the latest stable version.
Linux: Docker Engine
Windows: Docker Desktop (requires WSL 2)
Docker Compose: Latest stable version (included with Docker Desktop on Windows; install separately on Linux if needed).
Git: For cloning the Wazuh Docker repository.
Docker host requirements
You need to configure your Docker host to run Wazuh correctly on any system that uses a Linux kernel. This includes native Linux distributions and Windows with WSL 2 (Windows Subsystem for Linux version 2).
Set
max_map_countto262144on your Docker host. The Wazuh indexer creates many virtual memory areas (VMAs), so the kernel must allow more than the Linux default limit of65530. A VMA is a region of memory that lets applications like the Wazuh indexer access files directly from disk as if they were in RAM.Note
On Windows systems using WSL 2, run this command within the WSL 2 environment.
# sysctl -w vm.max_map_count=262144
Warning
If you don’t set
vm.max_map_countto at least262144, the Wazuh indexer might fail due to limited virtual memory mapping. This value lets the indexer map more files and index segments to memory, preventing errors or crashes.On native Linux systems, add your user to the
dockergroup if you want to run Docker without root privileges:# usermod -aG docker <USER>
Replace
<USER>with your username. Log out and back in for the change to take effect.
Exposed ports
The following ports are exposed when the Wazuh central components are deployed.
Port |
Component |
1514 |
Wazuh TCP |
1515 |
Wazuh TCP |
514 |
Wazuh UDP |
55000 |
Wazuh server API |
9200 |
Wazuh indexer API |
443 |
Wazuh dashboard HTTPS |
Wazuh central components
Below are the steps for deploying the Wazuh central components in single-node and multi-node stacks.
Warning
Do not run the single-node and multi-node stacks at the same time on the same Docker host. Both stacks use overlapping resources (such as container names, ports, and volumes), which can lead to conflicts, unexpected behavior, or data corruption.
Single-node stack deployment
Follow the steps below to deploy the Wazuh central components in a single-node stack.
Note
All deployment commands provided apply to both Windows and Linux environments.
Cloning the repository
Clone the Wazuh Docker repository to your system:
# git clone https://github.com/wazuh/wazuh-docker.git -b v5.0.0
Navigate to the
single-nodedirectory to execute all the following commands.# cd wazuh-docker/single-node/
Certificate generation
You must provide certificates for each node to secure communication between them in the Wazuh stack. You have two alternatives:
Wazuh self-signed certificates
Your own certificates
You must use the wazuh-certs-generator Docker image to generate self-signed certificates for each node of the stack.
Optional: Add the following to the
generate-indexer-certs.ymlfile if your system uses a proxy. If not, skip this step. Replace<YOUR_PROXY_ADDRESS_OR_DNS>with your proxy information.# Wazuh App Copyright (C) 2017, Wazuh Inc. (License GPLv2) services: generator: image: wazuh/wazuh-certs-generator:0.0.4 hostname: wazuh-certs-generator volumes: - ./config/wazuh_indexer_ssl_certs/:/certificates/ - ./config/certs.yml:/config/certs.yml environment: - HTTP_PROXY=<YOUR_PROXY_ADDRESS_OR_DNS>
Run the following command to generate the desired certificates:
# docker compose -f generate-indexer-certs.yml run --rm generator
The generated certificates will be stored in the wazuh-docker/single-node/config/wazuh_indexer_ssl_certs directory.
If you already have valid certificates for each node, place them in the wazuh-docker/single-node/config/wazuh_indexer_ssl_certs/ directory using the following file names. Note your stack for the right path.
Wazuh indexer:
wazuh-docker/single-node/config/wazuh_indexer_ssl_certs/root-ca.pem
wazuh-docker/single-node/config/wazuh_indexer_ssl_certs/wazuh.indexer-key.pem
wazuh-docker/single-node/config/wazuh_indexer_ssl_certs/wazuh.indexer.pem
wazuh-docker/single-node/config/wazuh_indexer_ssl_certs/admin.pem
wazuh-docker/single-node/config/wazuh_indexer_ssl_certs/admin-key.pem
Wazuh manager:
wazuh-docker/single-node/config/wazuh_indexer_ssl_certs/root-ca-manager.pem
wazuh-docker/single-node/config/wazuh_indexer_ssl_certs/wazuh.manager.pem
wazuh-docker/single-node/config/wazuh_indexer_ssl_certs/wazuh.manager-key.pem
Wazuh dashboard:
wazuh-docker/single-node/config/wazuh_indexer_ssl_certs/wazuh.dashboard.pem
wazuh-docker/single-node/config/wazuh_indexer_ssl_certs/wazuh.dashboard-key.pem
wazuh-docker/single-node/config/wazuh_indexer_ssl_certs/root-ca.pem
Deployment
Start the Wazuh Docker deployment using the
docker composecommand:# docker compose up -d
# docker compose up
Note
Docker does not dynamically reload the configuration. After changing a component's configuration, you need to restart the stack.
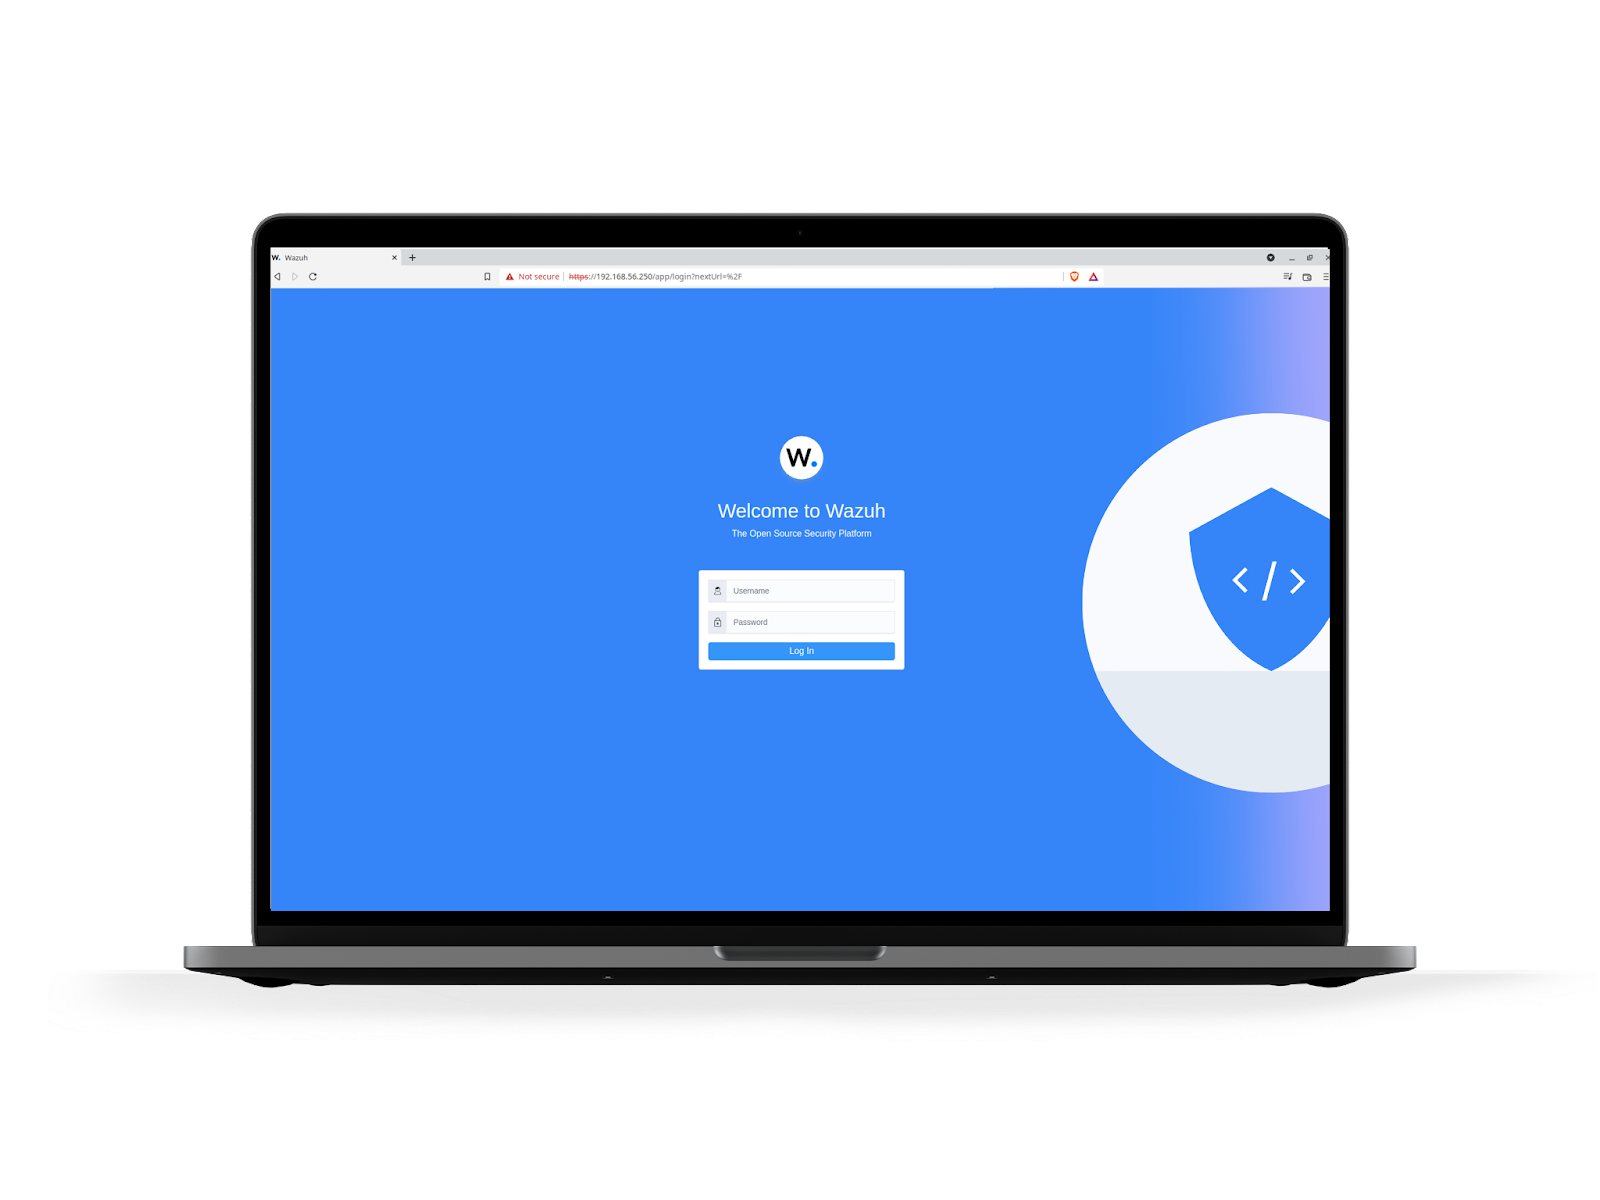
Accessing the Wazuh dashboard
After deploying the single-node stack, you can access the Wazuh dashboard using your Docker host's IP address or localhost.
https://<DOCKER_HOST_IP>
Note
If you use a self-signed certificate, your browser will display a warning that it cannot verify the certificate's authenticity.
This is the default username and password to access the Wazuh dashboard:
Username:
adminPassword:
SecretPassword
Refer to the changing the default password of Wazuh users section to learn more about additional security.
Note
To determine when the Wazuh indexer is up, the Wazuh dashboard container uses curl to repeatedly send queries to the Wazuh indexer API (port 9200). You can expect to see several Failed to connect to Wazuh indexer port 9200 log messages or Wazuh dashboard server is not ready yet until the Wazuh indexer is started. Then the setup process continues normally. It takes about one minute for the Wazuh indexer to start up. You can find the default Wazuh indexer credentials in the docker-compose.yml file.
Multi-node stack deployment
Follow the steps below to deploy the Wazuh central components in a multi-node stack.
Note
All deployment commands provided apply to both Windows and Linux environments.
Cloning the repository
Clone the Wazuh Docker repository to your system:
# git clone https://github.com/wazuh/wazuh-docker.git -b v5.0.0
Navigate to the
multi-nodedirectory to execute all the following commands.# cd wazuh-docker/multi-node/
Certificate generation
You must provide certificates for each node to secure communication between them in the Wazuh stack. You have two alternatives:
Wazuh self-signed certificates
Your own certificates
You must use the wazuh-certs-generator Docker image to generate self-signed certificates for each node of the stack.
Optional: Add the following to the
generate-indexer-certs.ymlfile if your system uses a proxy. If not, skip this step. Replace<YOUR_PROXY_ADDRESS_OR_DNS>with your proxy information.# Wazuh App Copyright (C) 2017, Wazuh Inc. (License GPLv2) services: generator: image: wazuh/wazuh-certs-generator:0.0.4 hostname: wazuh-certs-generator volumes: - ./config/wazuh_indexer_ssl_certs/:/certificates/ - ./config/certs.yml:/config/certs.yml environment: - HTTP_PROXY=<YOUR_PROXY_ADDRESS_OR_DNS>
Run the following command to generate the desired certificates:
# docker compose -f generate-indexer-certs.yml run --rm generator
The generated certificates will be stored in the wazuh-docker/multi-node/config/wazuh_indexer_ssl_certs directory.
If you already have valid certificates for each node, place them in the wazuh-docker/multi-node/config/wazuh_indexer_ssl_certs/ directory using the following file names. Note your stack for the right path.
Wazuh indexer:
wazuh-docker/multi-node/config/wazuh_indexer_ssl_certs/root-ca.pem
wazuh-docker/multi-node/config/wazuh_indexer_ssl_certs/wazuh.indexer-key.pem
wazuh-docker/multi-node/config/wazuh_indexer_ssl_certs/wazuh.indexer.pem
wazuh-docker/multi-node/config/wazuh_indexer_ssl_certs/admin.pem
wazuh-docker/multi-node/config/wazuh_indexer_ssl_certs/admin-key.pem
Wazuh manager:
wazuh-docker/multi-node/config/wazuh_indexer_ssl_certs/root-ca-manager.pem
wazuh-docker/multi-node/config/wazuh_indexer_ssl_certs/wazuh.manager.pem
wazuh-docker/multi-node/config/wazuh_indexer_ssl_certs/wazuh.manager-key.pem
Wazuh dashboard:
wazuh-docker/multi-node/config/wazuh_indexer_ssl_certs/wazuh.dashboard.pem
wazuh-docker/multi-node/config/wazuh_indexer_ssl_certs/wazuh.dashboard-key.pem
wazuh-docker/multi-node/config/wazuh_indexer_ssl_certs/root-ca.pem
Deployment
Start the Wazuh Docker deployment using the
docker composecommand:# docker compose up -d
# docker compose up
Note
Docker does not dynamically reload the configuration. After changing a component's configuration, you need to restart the stack.
Accessing the Wazuh dashboard
After deploying the multi-node stack, you can access the Wazuh dashboard using your Docker host's IP address or localhost.
https://<DOCKER_HOST_IP>
Note
If you use a self-signed certificate, your browser will display a warning that it cannot verify the certificate's authenticity.
This is the default username and password to access the Wazuh dashboard:
Username:
adminPassword:
SecretPassword
Refer to the changing the default password of Wazuh users section to learn more about additional security.
Note
To determine when the Wazuh indexer is up, the Wazuh dashboard container uses curl to repeatedly send queries to the Wazuh indexer API (port 9200). You can expect to see several Failed to connect to Wazuh indexer port 9200 log messages or Wazuh dashboard server is not ready yet until the Wazuh indexer is started. Then the setup process continues normally. It takes about one minute for the Wazuh indexer to start up. You can find the default Wazuh indexer credentials in the docker-compose.yml file.
Wazuh agent
Running the Wazuh agent in a Docker container provides a lightweight option for integrations and for collecting logs via syslog, without installing the agent directly on a host. However, when deployed this way, the containerized agent cannot directly access or monitor the host system.
Deployment
Follow these steps to deploy the Wazuh agent using Docker.
Clone the Wazuh Docker repository to your system:
# git clone https://github.com/wazuh/wazuh-docker.git -b v5.0.0
Navigate to the
wazuh-docker/wazuh-agent/directory within your repository:# cd wazuh-docker/wazuh-agent
Edit the
docker-compose.ymlfile. Replace<YOUR_WAZUH_MANAGER_IP>with the IP address of your Wazuh manager. Locate the environment section for the agent service and update it:# Wazuh App Copyright (C) 2017, Wazuh Inc. (License GPLv2) services: wazuh.agent: image: wazuh/wazuh-agent:5.0.0 restart: always environment: - WAZUH_MANAGER_SERVER=<WAZUH_MANAGER_IP> volumes: - ./config/wazuh-agent-conf:/wazuh-config-mount/etc/ossec.conf
Start the Wazuh agent deployment using
docker compose:# docker compose up -d
# docker compose up
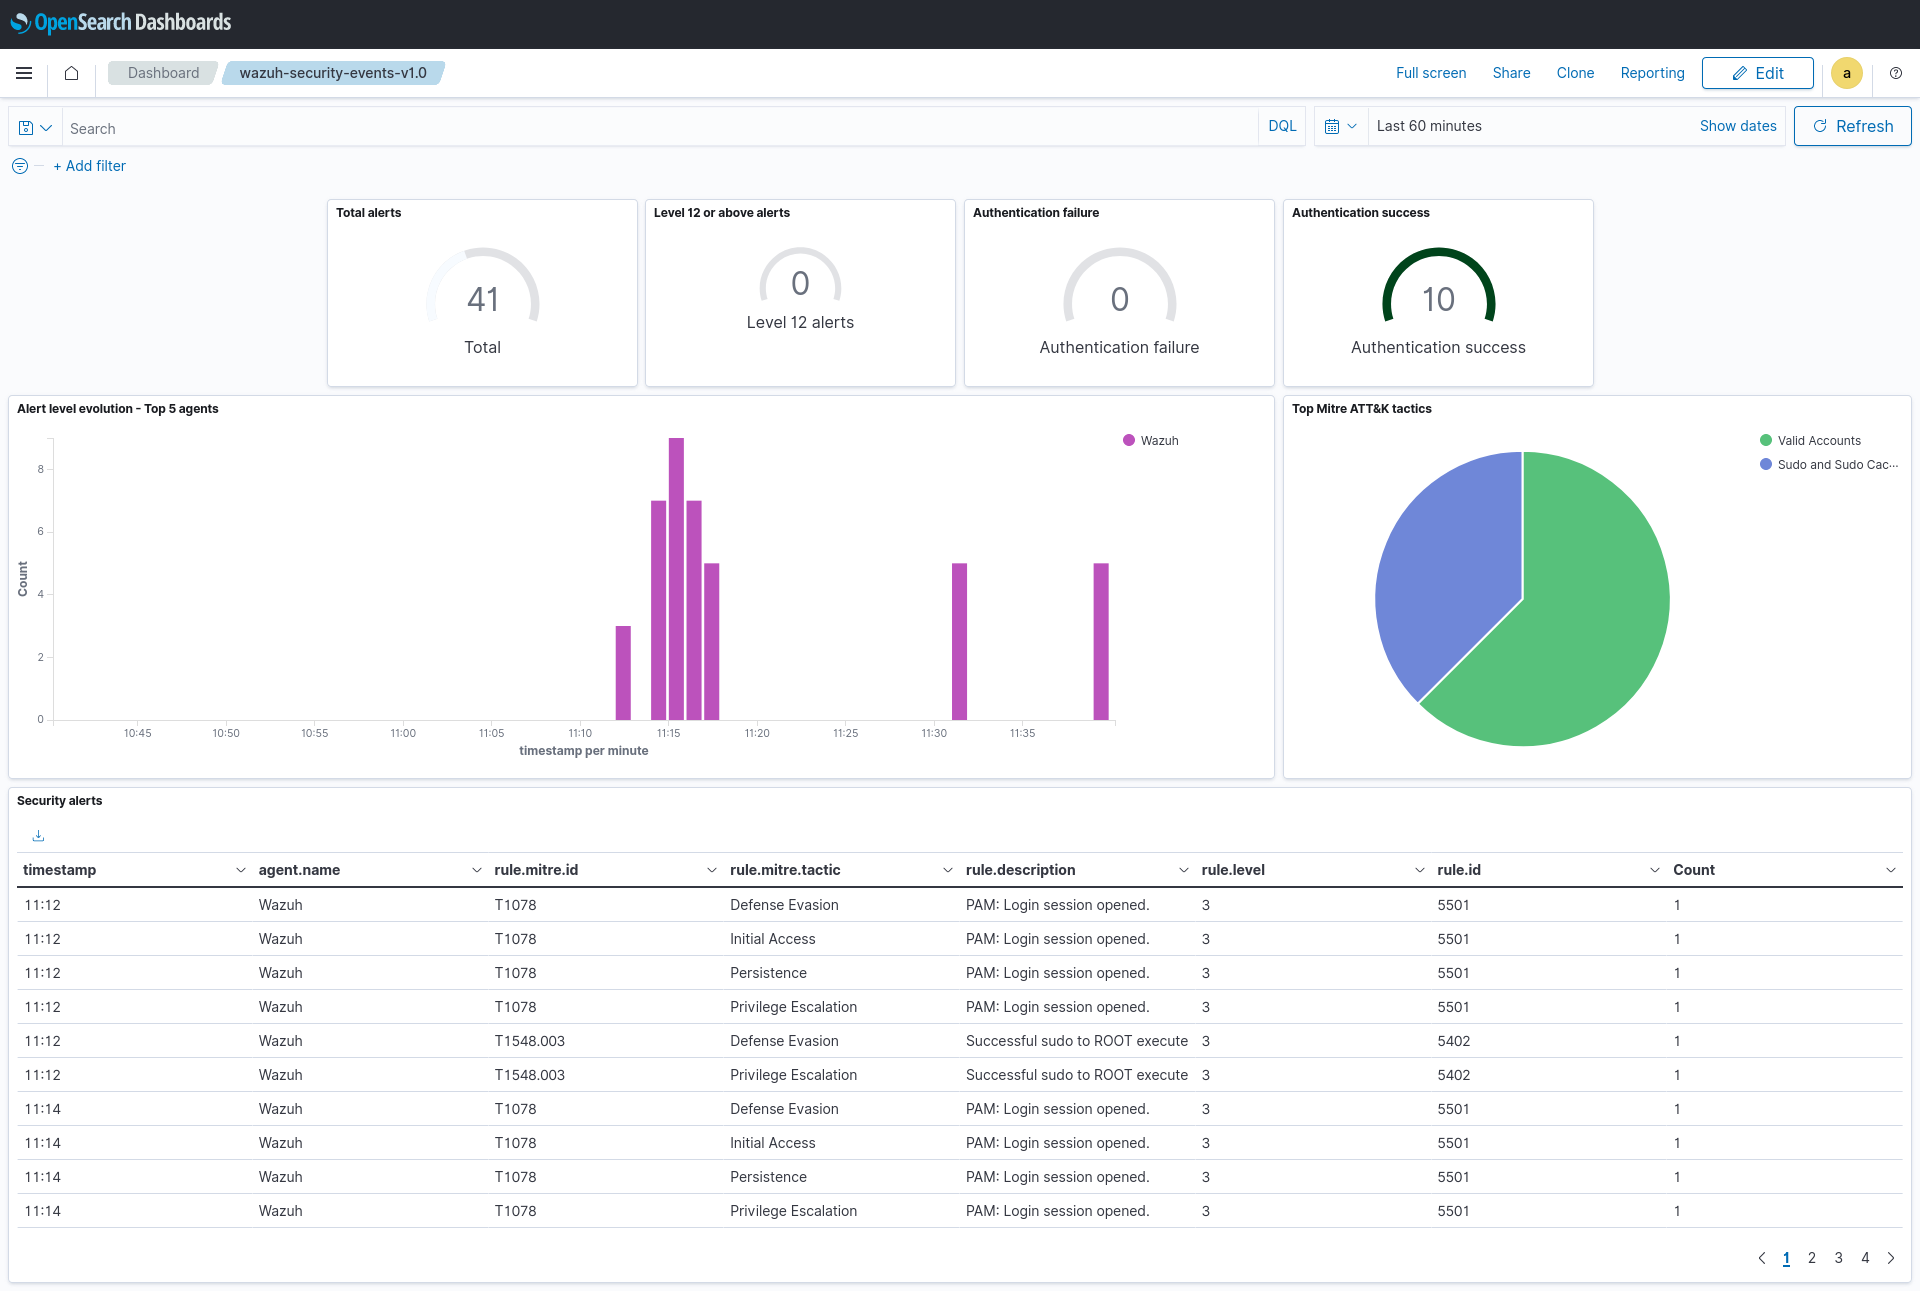
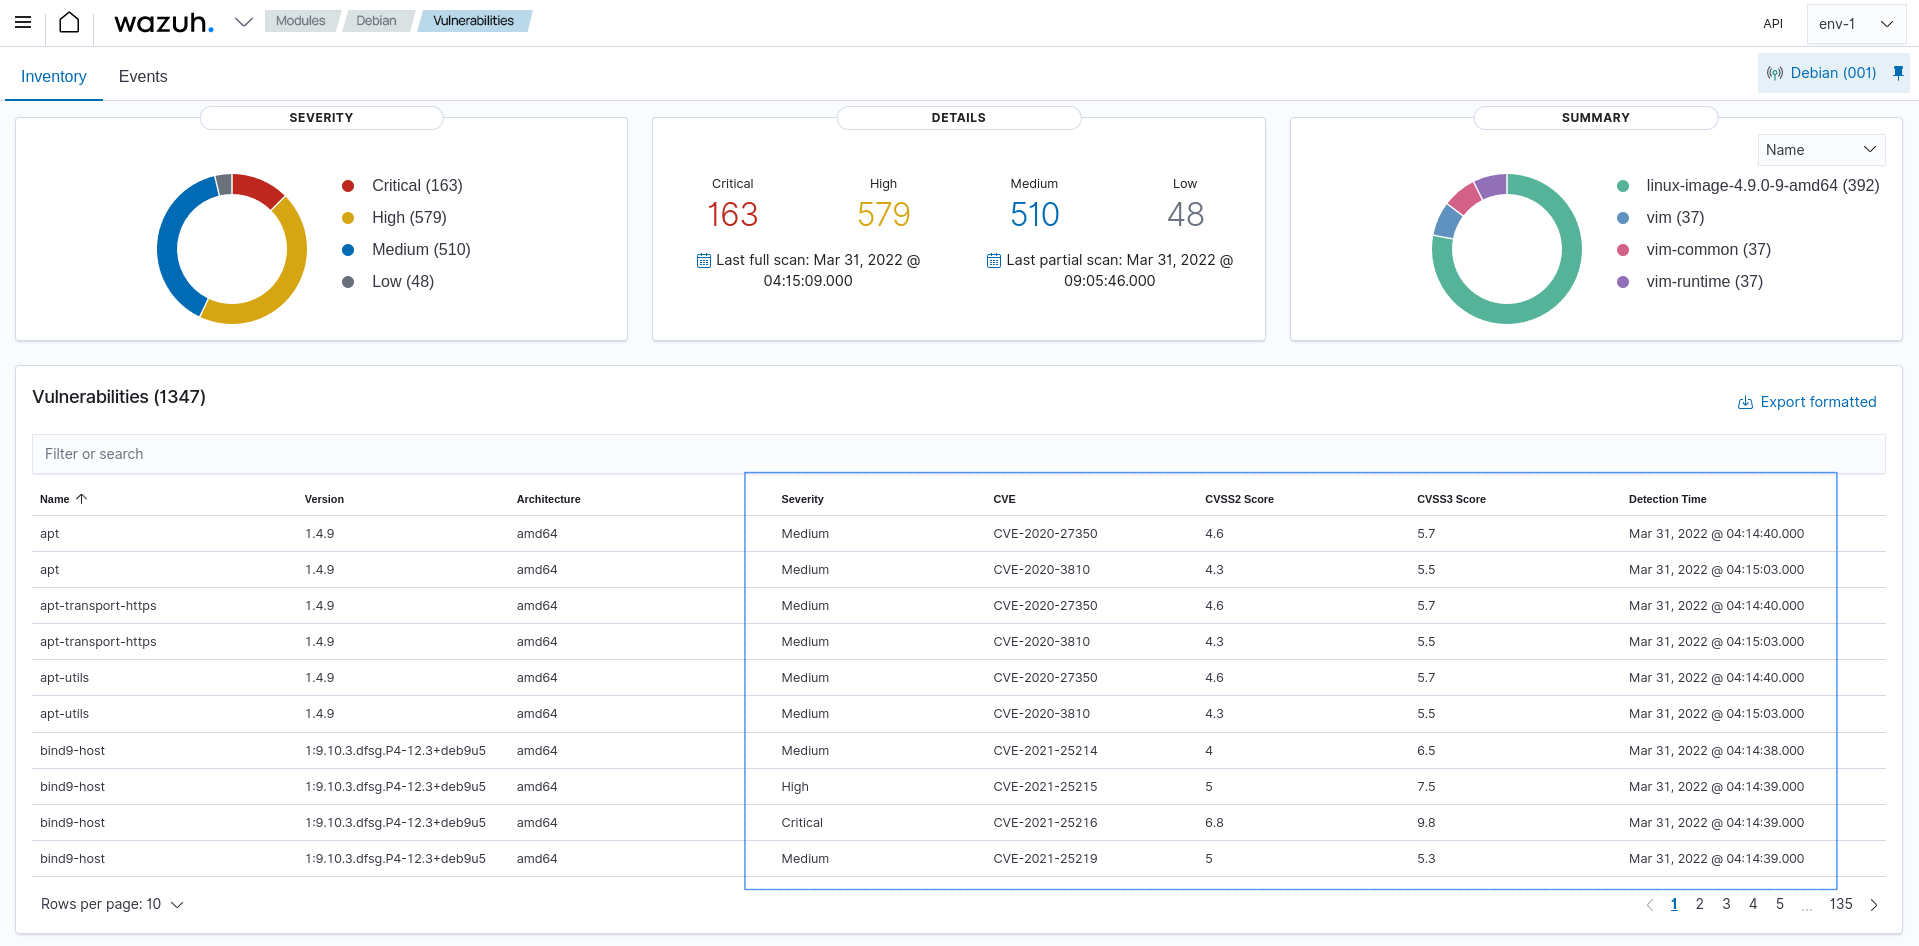
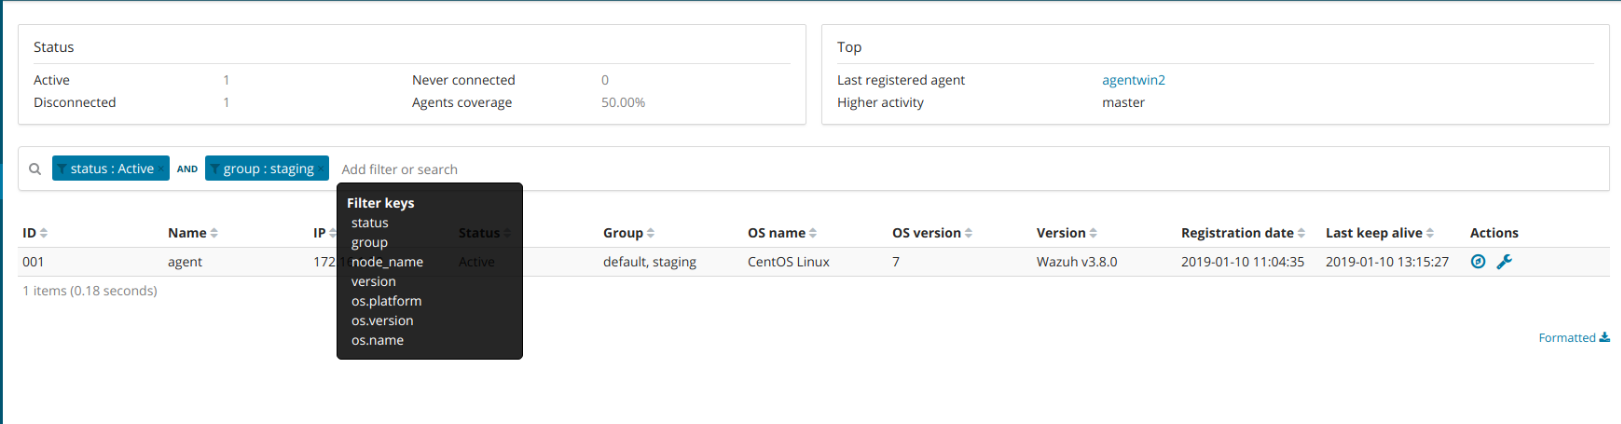
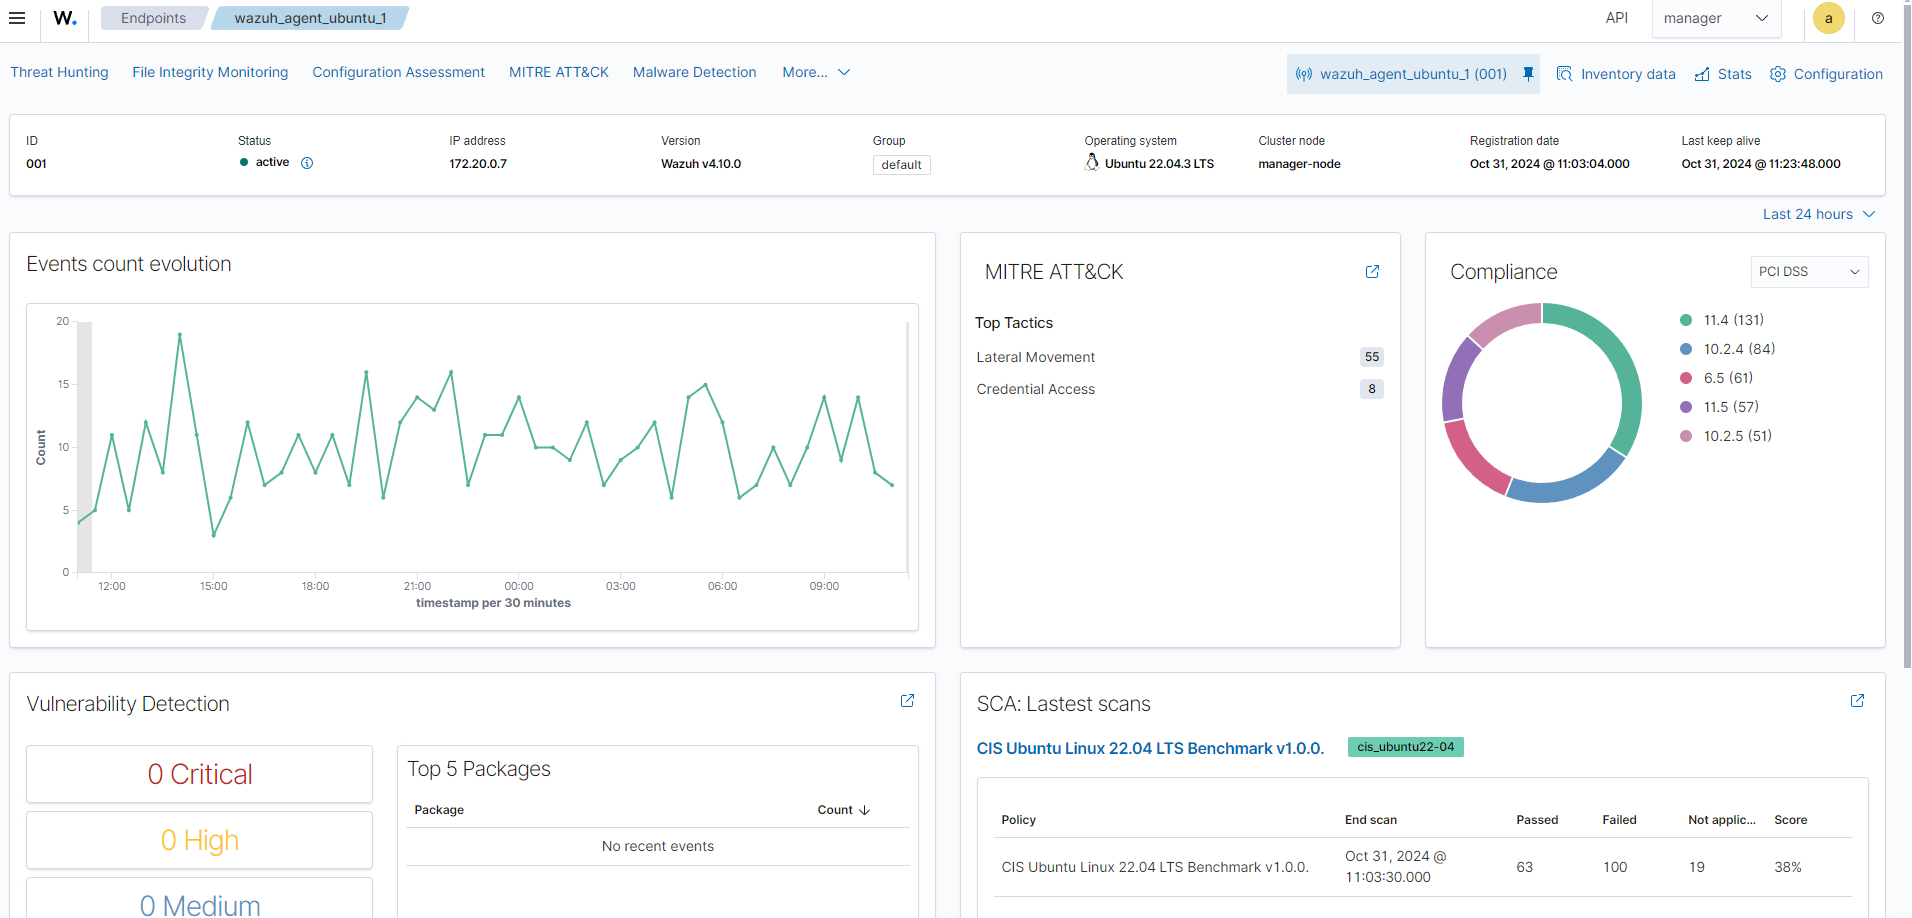
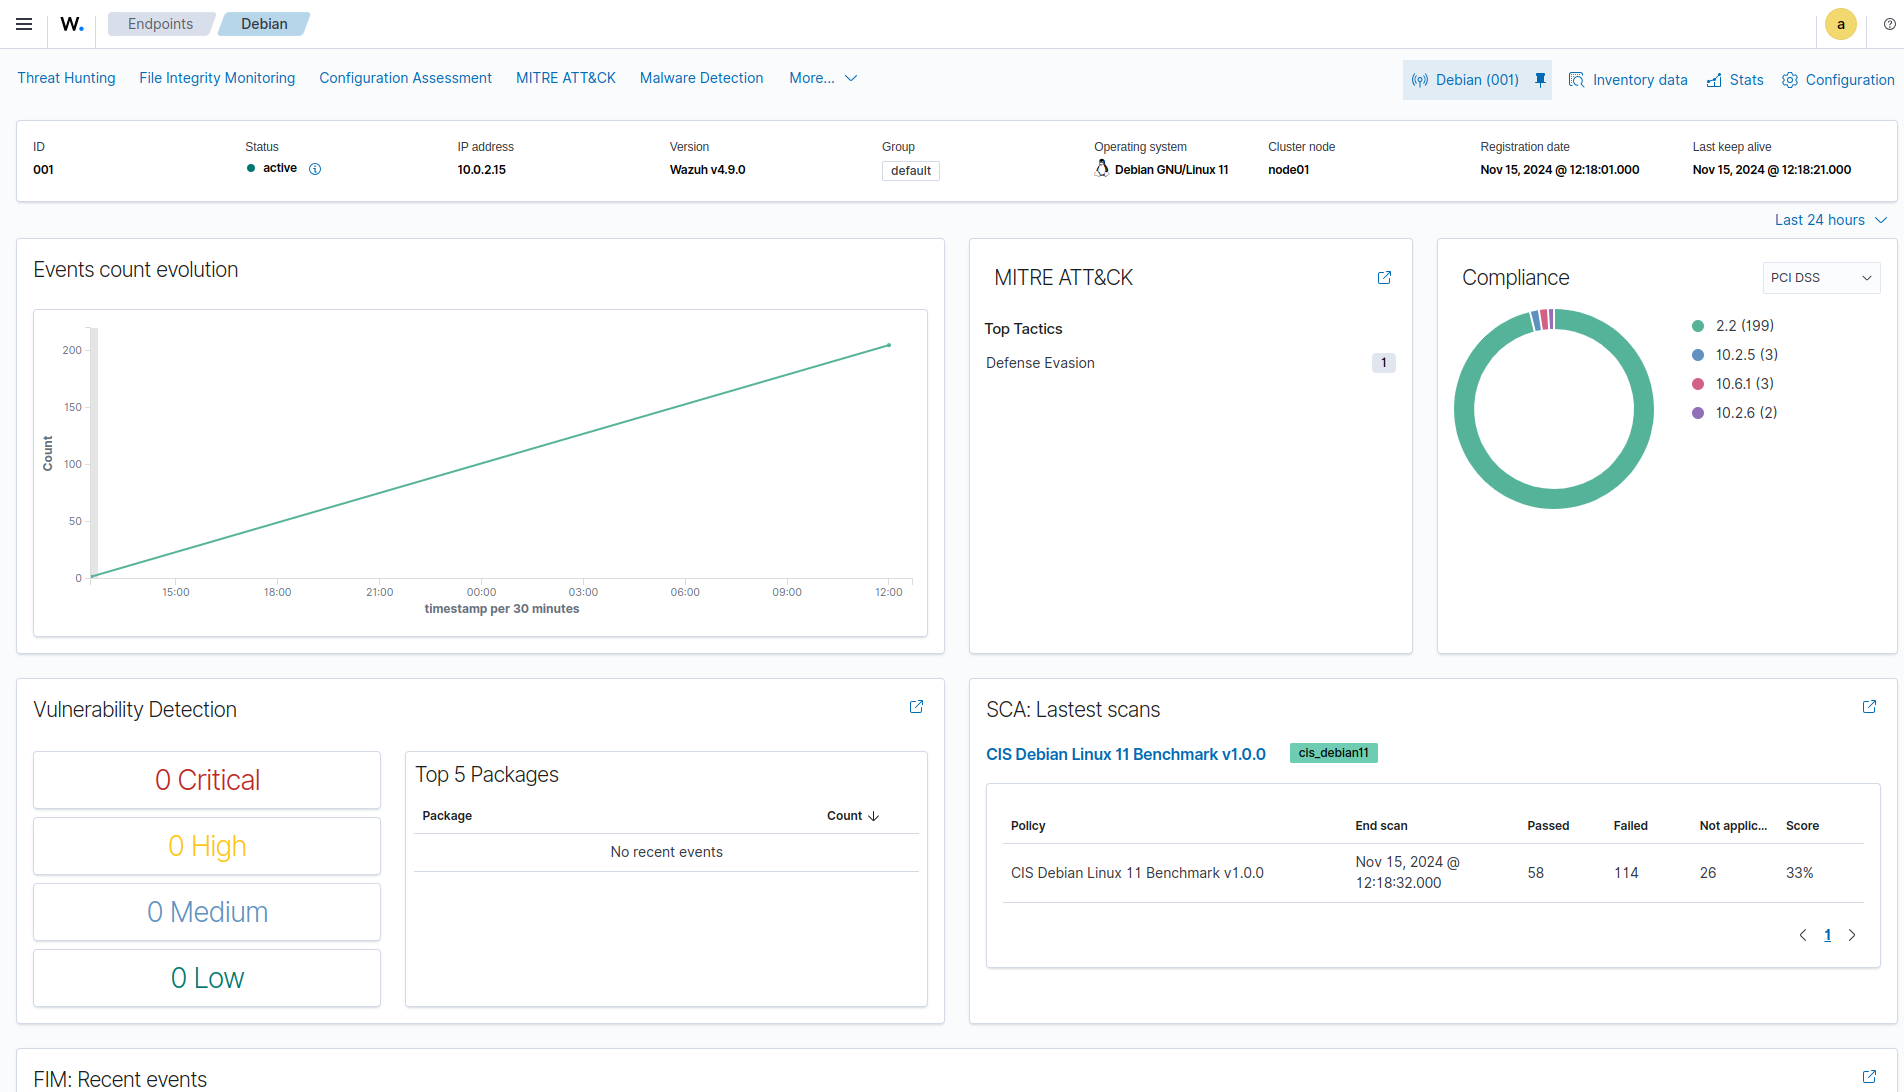
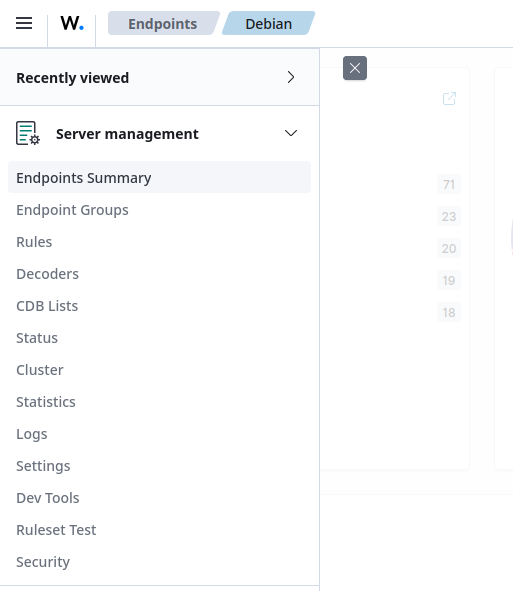
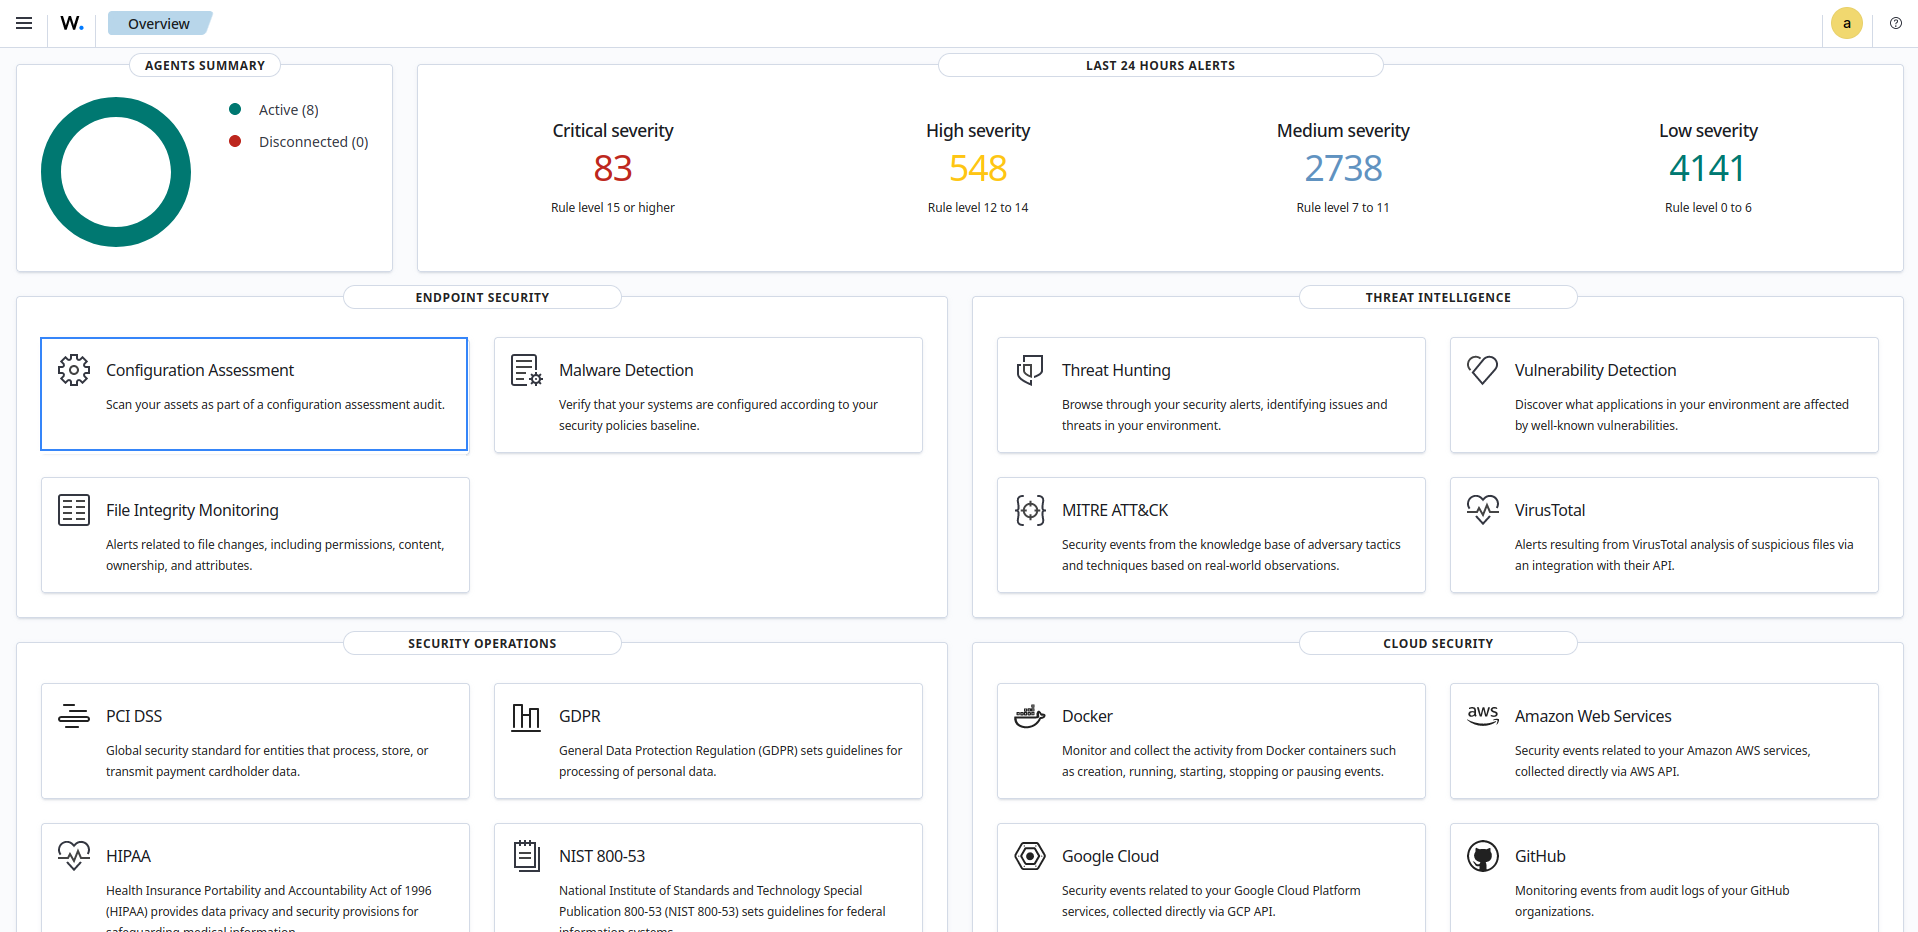
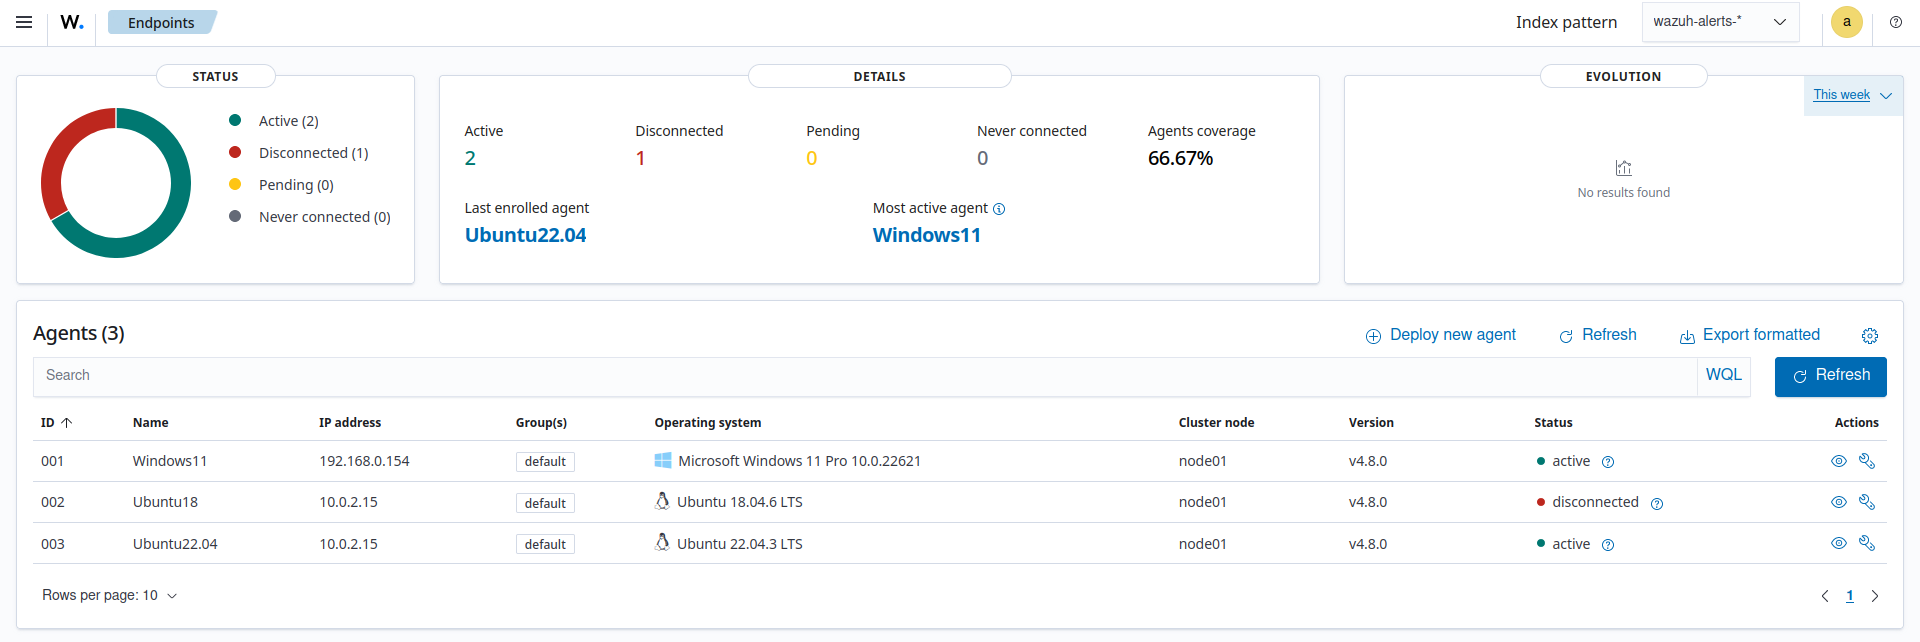
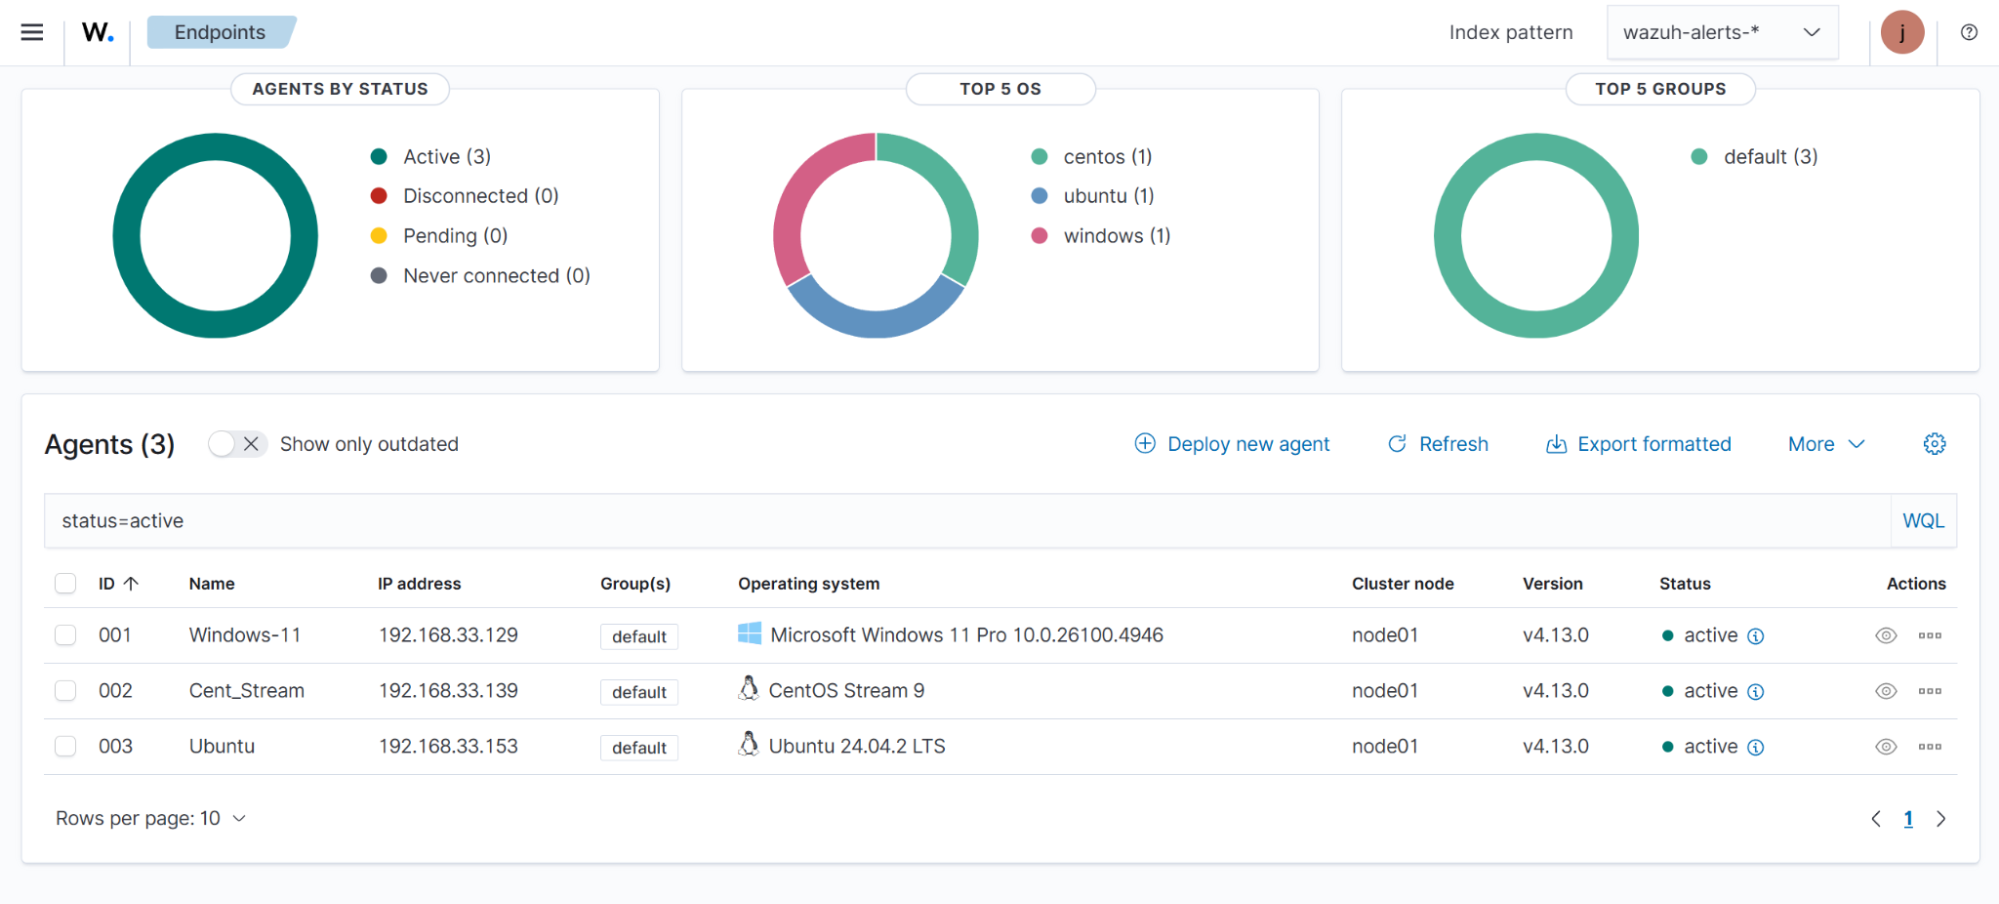
Verify from your Wazuh dashboard that the Wazuh agent deployment was successful and visible. Navigate to the Agent management > Summary, and you should see the Wazuh agent container active on your dashboard.
Changing the default password of Wazuh users
We recommend changing the default Wazuh user's password to improve security.
There are two types of users on Wazuh Docker environments:
Follow the steps below to change the password of these Wazuh users.
Note
Depending on your Wazuh Docker stack, you must run the commands from the wazuh-docker/single-node or wazuh-docker/multi-node directory.
Wazuh indexer user
The Wazuh indexer has the admin and kibanaserver users by default. You can access the Wazuh dashboard using either the admin or kibanaserver user credentials.
To change these credentials, you must:
Warning
You can only change one user's password at a time.
If you have custom users, add them to the
config/wazuh_indexer/internal_users.ymlfile in the deployment model directory. Otherwise, executing this procedure deletes them.
Logging out of your Wazuh dashboard
You must log out of your Wazuh dashboard before starting the password change process. If you don't, persistent session cookies will cause errors when accessing Wazuh after changing user passwords.
Setting the new password in the Docker Compose file
Note
If your password contains the $ character, you must escape it by doubling it. For example, to set the password Secret$Password in the docker-compose.yml file, write it as Secret$$Password.
Open the
docker-compose.ymlfile. Change all occurrences of the old password with the new one. For example, for a single-node stack:... services: wazuh.manager: ... environment: - INDEXER_URL=https://wazuh.indexer:9200 - INDEXER_USERNAME=admin - INDEXER_PASSWORD=SecretPassword - FILEBEAT_SSL_VERIFICATION_MODE=full - SSL_CERTIFICATE_AUTHORITIES=/etc/ssl/root-ca.pem - SSL_CERTIFICATE=/etc/ssl/filebeat.pem - SSL_KEY=/etc/ssl/filebeat.key - API_USERNAME=wazuh-wui - API_PASSWORD=MyS3cr37P450r.*- ... wazuh.indexer: ... environment: - "OPENSEARCH_JAVA_OPTS=-Xms1024m -Xmx1024m" ... wazuh.dashboard: ... environment: - INDEXER_USERNAME=admin - INDEXER_PASSWORD=SecretPassword - WAZUH_API_URL=https://wazuh.manager - DASHBOARD_USERNAME=kibanaserver - DASHBOARD_PASSWORD=kibanaserver - API_USERNAME=wazuh-wui - API_PASSWORD=MyS3cr37P450r.*- ...
... services: wazuh.dashboard: ... environment: - INDEXER_USERNAME=admin - INDEXER_PASSWORD=SecretPassword - WAZUH_API_URL=https://wazuh.manager - DASHBOARD_USERNAME=kibanaserver - DASHBOARD_PASSWORD=kibanaserver - API_USERNAME=wazuh-wui - API_PASSWORD=MyS3cr37P450r.*- ...
Setting a new hash
Follow the steps below to generate and set a new password hash for your Wazuh users.
Stop the stack if it's running:
# docker compose down
Run this command to generate the hash for your new password:
# docker run --rm -ti wazuh/wazuh-indexer:5.0.0 bash /usr/share/wazuh-indexer/plugins/opensearch-security/tools/hash.sh
Once the container launches, input the new password and press Enter.
Copy the generated hash.
Open the
config/wazuh_indexer/internal_users.ymlfile. Locate the block for the user whose password you want to change.Replace
<NEW_HASH>with your hash values.... admin: hash: "<NEW_HASH>" reserved: true backend_roles: - "admin" description: "Demo admin user" ...
... kibanaserver: hash: "<NEW_HASH>" reserved: true description: "Demo kibanaserver user" ...
Save the changes.
Applying the changes
After updating docker-compose.yml file, restart the Wazuh Docker stack and reapply settings using the securityadmin.sh tool.
Start the deployment stack.
# docker compose up -d
Run
docker psand note the name of the first Wazuh indexer container. For example,single-node-wazuh.indexer-1, ormulti-node-wazuh1.indexer-1.Run
docker exec -it <WAZUH_INDEXER_CONTAINER_NAME> bashto access the container. Replace<WAZUH_INDEXER_CONTAINER_NAME>with the Wazuh indexer container name. For example, usesingle-node-wazuh.indexer-1for the single-node stack andmulti-node-wazuh1.indexer-1for the multi-node stack:# docker exec -it single-node-wazuh.indexer-1 bash
Set the following variables:
export INSTALLATION_DIR=/usr/share/wazuh-indexer export CONFIG_DIR=$INSTALLATION_DIR/config CACERT=$CONFIG_DIR/certs/root-ca.pem KEY=$CONFIG_DIR/certs/admin-key.pem CERT=$CONFIG_DIR/certs/admin.pem export JAVA_HOME=/usr/share/wazuh-indexer/jdk
Wait for the Wazuh indexer to initialize properly. The waiting time can vary from one to five minutes. It depends on the size of the cluster, the assigned resources, and the network speed. Then, run the
securityadmin.shscript to apply all changes.$ bash /usr/share/wazuh-indexer/plugins/opensearch-security/tools/securityadmin.sh -cd $CONFIG_DIR/opensearch-security/ -nhnv -cacert $CACERT -cert $CERT -key $KEY -p 9200 -icl
$ HOST=$(grep node.name $CONFIG_DIR/opensearch.yml | awk '{printf $2}') $ bash /usr/share/wazuh-indexer/plugins/opensearch-security/tools/securityadmin.sh -cd $CONFIG_DIR/opensearch-security/ -nhnv -cacert $CACERT -cert $CERT -key $KEY -p 9200 -icl -h $HOST
Note
When working on Docker Desktop with a multi-node stack, use the
multi-node-wazuh1.indexer-1IP address instead of the$HOSTvariable.Exit the Wazuh indexer container. Refresh the Wazuh dashboard and log in with the new credentials.
Wazuh server API users
The wazuh-wui user is the default user for connecting to the Wazuh server API. Follow these steps to change the password.
Warning
The password for Wazuh server API users must be between 8 and 64 characters long and contain at least one uppercase and lowercase letter, number, and symbol. The Wazuh manager service will fail to start if these requirements are unmet.
Open the
config/wazuh_dashboard/wazuh.ymlfile and modify the value of thepasswordparameter.... hosts: - 1513629884013: url: "https://wazuh.manager" port: 55000 username: wazuh-wui password: "MyS3cr37P450r.*-" run_as: false ...
Open the
docker-compose.ymlfile. Change all occurrences of the old password with the new one.... services: wazuh.manager: ... environment: - INDEXER_URL=https://wazuh.indexer:9200 - INDEXER_USERNAME=admin - INDEXER_PASSWORD=SecretPassword - FILEBEAT_SSL_VERIFICATION_MODE=full - SSL_CERTIFICATE_AUTHORITIES=/etc/ssl/root-ca.pem - SSL_CERTIFICATE=/etc/ssl/filebeat.pem - SSL_KEY=/etc/ssl/filebeat.key - API_USERNAME=wazuh-wui - API_PASSWORD=MyS3cr37P450r.*- ... wazuh.dashboard: ... environment: - INDEXER_USERNAME=admin - INDEXER_PASSWORD=SecretPassword - WAZUH_API_URL=https://wazuh.manager - DASHBOARD_USERNAME=kibanaserver - DASHBOARD_PASSWORD=kibanaserver - API_USERNAME=wazuh-wui - API_PASSWORD=MyS3cr37P450r.*- ...
Recreate the Wazuh containers:
# docker compose down # docker compose up -d
Refer to logging in to the Wazuh server API via the command line to learn more.
Building Docker images locally
You can modify and build Docker images for the Wazuh central components (manager, indexer, and dashboard) and the Wazuh agent.
Clone the Wazuh Docker repository to your system:
# git clone https://github.com/wazuh/wazuh-docker.git -b v5.0.0
Navigate to the
build-docker-imagesdirectory:# cd wazuh-docker/build-docker-images
Run the build script:
# ./build-images.sh
This process builds Docker images for all Wazuh components on your local system.
Wazuh Docker utilities
After deploying Wazuh with Docker, you can perform several tasks to manage and customize your installation. Wazuh components are deployed as separate containers built from their corresponding Docker image. You can access these containers using the service names defined in your docker-compose.yml file, which are specific to your deployment type.
Access to services and containers
This section explains how to interact with your Wazuh deployment by accessing service logs and shell instances of running containers.
Access the Wazuh dashboard using the Docker host IP address.
Enroll agents through the Wazuh agent Docker deployment or the standard Wazuh agent enrollment process. Use the Docker host address as the Wazuh manager address.
List the containers in the directory where the Wazuh
docker-compose.ymlfile is located:# docker compose ps
NAME COMMAND SERVICE STATUS PORTS single-node-wazuh.dashboard-1 "/entrypoint.sh" wazuh.dashboard running 443/tcp, 0.0.0.0:443->5601/tcp single-node-wazuh.indexer-1 "/entrypoint.sh open…" wazuh.indexer running 0.0.0.0:9200->9200/tcp single-node-wazuh.manager-1 "/init" wazuh.manager running 0.0.0.0:1514-1515->1514-1515/tcp, 0.0.0.0:514->514/udp, 0.0.0.0:55000->55000/tcp, 1516/tcp
Run the command below from the directory where the
docker-compose.ymlfile is located to open a shell inside the container:# docker compose exec <SERVICE> bash
Wazuh service data volumes
You can set Wazuh configuration and log files to exist outside their containers on the host system. This allows the files to persist after containers are removed, and you can provision custom configuration files to your containers.
Listing existing volumes
Run the following to see the persistent volumes on your Docker host:
# docker volume ls
DRIVER VOLUME NAME
local single-node_wazuh_api_configuration
You can also view these volumes in the volumes section directly from the docker-compose.yml file.
Adding a custom volume
You need multiple volumes to ensure persistence on the Wazuh server, Wazuh indexer, and Wazuh dashboard containers. Investigate the volumes section in your docker-compose.yml file and modify it to include your custom volumes:
services:
wazuh.manager:
. . .
volumes:
- wazuh_api_configuration:/var/ossec/api/configuration
. . .
volumes:
wazuh_api_configuration:
Custom commands and scripts
Run the command below to execute commands inside the containers. We use the Wazuh manager single-node-wazuh.manager-1 container in this example:
# docker exec -it single-node-wazuh.manager-1 bash
Every change made on this shell persists because of the data volumes.
Note
The actions you can perform inside the containers are limited.
Modifying the Wazuh configuration file
To customize the Wazuh configuration file /var/ossec/etc/ossec.conf, modify the appropriate configuration file on the Docker host according to your business needs. These local files are mounted into the containers at runtime, allowing your custom settings to persist across container restarts or rebuilds.
Run the following command in your deployment directory to stop the running containers:
# docker compose down
The following are the locations of the Wazuh configuration files on the Docker host that you can modify:
wazuh-docker/single-node/config/wazuh_cluster/wazuh_manager.confManager:
wazuh-docker/multi-node/config/wazuh_cluster/wazuh_manager.confWorker:
wazuh-docker/multi-node/config/wazuh_cluster/wazuh_worker.conf
wazuh-docker/wazuh-agent/config/wazuh-agent-confSave the changes made in the configuration files.
Restart the stack:
# docker compose up -d
These files are mounted into the container at runtime (wazuh-config-mount/etc/ossec.conf), ensuring your changes take effect when the containers start.
Tuning Wazuh services
Tuning the Wazuh indexer and dashboard is optional. You can apply custom configurations only if you need to adjust performance, customize the dashboard interface, or override default settings.
The Wazuh indexer reads its configuration from the file(s) in the
config/wazuh_indexer/directory in your respective deployment stack. Edit the appropriate configuration file(s) with your desired parameters, and ensure any changes made are properly mapped in yourdocker-compose.ymlso the container loads the updated configuration.The Wazuh dashboard reads its configuration from the
config/wazuh_dashboard/opensearch_dashboards.ymlfile. You can adjust dashboard behavior or appearance by modifying parameters in this file. Refer to the OpenSearch documentation on Modifying the YAML files for details about the available variables you can override in this configuration.
Upgrading Wazuh Docker
This section describes how to upgrade the Wazuh deployment on Docker.
To upgrade to version 5.0.0, choose one of the following strategies.
Using the default Docker Compose files: Replace the existing
docker-compose.ymlfile with the default one provided for Wazuh 5.0.0.Keeping your custom Docker Compose files: Retain your existing
docker-compose.ymlfile of your outdated Wazuh Docker deployment and apply the upgrade without replacing it.
Using the default Docker Compose files
Follow these steps to upgrade your deployment using the default docker-compose.yml file:
Run the following command from your
wazuh-docker/single-node/orwazuh-docker/multi-node/directory to stop the outdated environment:# docker compose down
Update your local repository to fetch the latest tags:
# git fetch --all --tags
Check out the tag for the current version of
wazuh-docker:# git checkout v5.0.0
This command switches your local repository to the specified release tag, ensuring the deployment uses that version's exact configuration and files.
Note
Replace
v5.0.0with the tag of any other Wazuh version you want to upgrade to. You can rungit tag -lto see all available versions.Start the upgraded Wazuh Docker environment using the
docker composecommand:# docker compose up -d
Your data and certificates remain persistent because they are stored in mounted Docker volumes. This means upgrading the environment does not erase your existing configuration or indexed data.
Keeping your custom Docker Compose files
To upgrade your deployment while preserving your custom docker-compose.yml file, follow these steps:
Single-node stack
Run the following command from your
wazuh-docker/single-node/directory to stop the outdated environment:# docker compose down
If upgrading from a version earlier than 4.8, edit the
single-node/config/wazuh_dashboard/opensearch_dashboards.ymlfile and update thedefaultRouteparameter as follows:uiSettings.overrides.defaultRoute: /app/wz-home
Optional: Modify the
OPENSEARCH_JAVA_OPTSenvironment variable in thesingle-node/docker-compose.ymlfile to allocate more RAM to the Wazuh indexer container.environment: - "OPENSEARCH_JAVA_OPTS=-Xms1g -Xmx1g"
In
single-node/generate-indexer-certs.yml, update the image generator tag to the latest version and add theCERT_TOOL_VERSIONenvironment variable.services: generator: image: wazuh/wazuh-certs-generator:0.0.4 environment: - CERT_TOOL_VERSION=5.0
Recreate the certificates after these changes.
# docker compose -f generate-indexer-certs.yml run --rm generator
Optional: Update old paths with the new ones based on the version you are upgrading from.
Wazuh dashboard
Edit
single-node/config/wazuh_dashboard/opensearch_dashboards.ymland do the following replacements.Replace
/usr/share/wazuh-dashboard/config/certs/with/usr/share/wazuh-dashboard/certs/.
Edit
single-node/docker-compose.ymland do the following replacements.Replace
/usr/share/wazuh-dashboard/config/certs/with/usr/share/wazuh-dashboard/certs/.
Wazuh indexer
Edit the
single-node/config/wazuh_indexer/wazuh.indexer.ymlfile and do the following replacements.Replace
${OPENSEARCH_PATH_CONF}/certs/with/usr/share/wazuh-indexer/config/certs/.
Edit the
single-node/docker-compose.ymlfile and do the following replacements.Replace
/usr/share/wazuh-indexer/plugins/opensearch-security/securityconfig/with/usr/share/wazuh-indexer/opensearch-security/.
Wazuh indexer
Edit the
single-node/config/wazuh_indexer/wazuh.indexer.ymlfile and do the following replacements.Replace
/usr/share/wazuh-indexer/certs/with/usr/share/wazuh-indexer/config/certs/.
Edit the
single-node/docker-compose.ymlfile and do the following replacements.Replace
/usr/share/wazuh-indexer/certs/with/usr/share/wazuh-indexer/config/certs/.Replace
/usr/share/wazuh-indexer/opensearch.ymlwith/usr/share/wazuh-indexer/config/opensearch.yml.Replace
/usr/share/wazuh-indexer/opensearch-security/internal_users.ymlwith/usr/share/wazuh-indexer/config/opensearch-security/internal_users.yml.
Edit the
docker-compose.ymlfile and update the highlighted lines to the latest images.wazuh.manager: image: wazuh/wazuh-manager:5.0.0 ... wazuh.indexer: image: wazuh/wazuh-indexer:5.0.0 ... wazuh.dashboard: image: wazuh/wazuh-dashboard:5.0.0
Optional: If you are upgrading from Wazuh version 4.3, add the variable related to the
kibanaserveruser.... wazuh.dashboard: image: wazuh/wazuh-dashboard:5.0.0 environment: - INDEXER_USERNAME=admin - INDEXER_PASSWORD=SecretPassword - WAZUH_API_URL=https://wazuh.manager - DASHBOARD_USERNAME=kibanaserver - DASHBOARD_PASSWORD=kibanaserver
Replace the content of
single-node/config/wazuh_cluster/wazuh_manager.conffile in your stack with the one from the v5.0.0 tag of the Wazuh Docker repository.# curl -sL https://raw.githubusercontent.com/wazuh/wazuh-docker/v5.0.0/single-node/config/wazuh_cluster/wazuh_manager.conf > single-node/config/wazuh_cluster/wazuh_manager.conf
Start the new version of Wazuh using the
docker composecommand:# docker compose up -d
Multi-node stack
Run the following command from your
wazuh-docker/multi-node/directory to stop the outdated environment:# docker compose down
If upgrading from a version earlier than 4.8, edit
multi-node/config/wazuh_dashboard/opensearch_dashboards.ymlfile and update thedefaultRouteparameter as follows:uiSettings.overrides.defaultRoute: /app/wz-home
Optional: Modify the
OPENSEARCH_JAVA_OPTSenvironment variable in themulti-node/docker-compose.ymlfile to allocate more RAM to the Wazuh indexer container.environment: - "OPENSEARCH_JAVA_OPTS=-Xms1g -Xmx1g"
In
multi-node/generate-indexer-certs.yml, update the image generator tag to the latest version and add theCERT_TOOL_VERSIONenvironment variable.services: generator: image: wazuh/wazuh-certs-generator:0.0.4 environment: - CERT_TOOL_VERSION=5.0
Recreate the certificates after these changes.
# docker compose -f generate-indexer-certs.yml run --rm generator
Optional: Update these old paths with the new ones based on the version you are upgrading from.
Wazuh dashboard
Edit
multi-node/config/wazuh_dashboard/opensearch_dashboards.ymland do the following replacements.Replace
/usr/share/wazuh-dashboard/config/certs/with/usr/share/wazuh-dashboard/certs/.
Edit
multi-node/docker-compose.ymland do the following replacements.Replace
/usr/share/wazuh-dashboard/config/certs/with/usr/share/wazuh-dashboard/certs/.
Wazuh indexer
Edit the
multi-node/config/wazuh_indexer/wazuh1.indexer.yml,multi-node/config/wazuh_indexer/wazuh2.indexer.yml, andmulti-node/config/wazuh_indexer/wazuh3.indexer.ymlfiles and do the following replacements.Replace
${OPENSEARCH_PATH_CONF}/certs/with/usr/share/wazuh-indexer/config/certs/.
Edit the
multi-node/docker-compose.ymlfile and do the following replacements.Replace
/usr/share/wazuh-indexer/plugins/opensearch-security/securityconfig/with/usr/share/wazuh-indexer/opensearch-security/.
Wazuh indexer
Edit the
multi-node/config/wazuh_indexer/wazuh1.indexer.yml,multi-node/config/wazuh_indexer/wazuh2.indexer.yml, andmulti-node/config/wazuh_indexer/wazuh3.indexer.ymlfiles and do the following replacements.Replace
/usr/share/wazuh-indexer/certs/with/usr/share/wazuh-indexer/config/certs/.
Edit the
multi-node/docker-compose.ymlfile and do the following replacements.Replace
/usr/share/wazuh-indexer/certs/with/usr/share/wazuh-indexer/config/certs/.Replace
/usr/share/wazuh-indexer/opensearch.ymlwith/usr/share/wazuh-indexer/config/opensearch.yml.Replace
/usr/share/wazuh-indexer/opensearch-security/internal_users.ymlwith/usr/share/wazuh-indexer/config/opensearch-security/internal_users.yml.
Edit the
docker-compose.ymlfile and update the highlighted lines to the latest images.wazuh.master: image: wazuh/wazuh-manager:5.0.0 ... wazuh.worker: image: wazuh/wazuh-manager:5.0.0 ... wazuh1.indexer: image: wazuh/wazuh-indexer:5.0.0 ... wazuh2.indexer: image: wazuh/wazuh-indexer:5.0.0 ... wazuh3.indexer: image: wazuh/wazuh-indexer:5.0.0 ... wazuh.dashboard: image: wazuh/wazuh-dashboard:5.0.0
Optional: If you are updating from Wazuh version 4.3, add the variable related to the
kibanaserveruser.... wazuh.dashboard: image: wazuh/wazuh-dashboard:5.0.0 environment: - OPENSEARCH_HOSTS="https://wazuh1.indexer:9200" - WAZUH_API_URL="https://wazuh.master" - API_USERNAME=wazuh-wui - API_PASSWORD=MyS3cr37P450r.*- - DASHBOARD_USERNAME=kibanaserver - DASHBOARD_PASSWORD=kibanaserver
Replace the content of the following files in your stack with the ones from the v5.0.0 tag of the Wazuh Docker repository.
multi-node/config/wazuh_cluster/wazuh_manager.conf# curl -sL https://raw.githubusercontent.com/wazuh/wazuh-docker/v5.0.0/multi-node/config/wazuh_cluster/wazuh_manager.conf > multi-node/config/wazuh_cluster/wazuh_manager.conf
multi-node/config/wazuh_cluster/wazuh_worker.conf# curl -sL https://raw.githubusercontent.com/wazuh/wazuh-docker/v5.0.0/multi-node/config/wazuh_cluster/wazuh_worker.conf > multi-node/config/wazuh_cluster/wazuh_worker.conf
Start the new version of Wazuh using the
docker composecommand:# docker compose up -d
Uninstalling the Wazuh Docker deployment
Follow these steps to uninstall your Wazuh Docker deployment from your Docker host:
Navigate to the directory of your deployment model.
Stop the stack:
# docker compose down
This command stops all running containers and removes them, but preserves your data volumes and configuration files.
Optional: Delete persistent volumes.
List all volumes first to confirm what you want to delete:
# docker volume ls
If you created custom volumes for logs, configuration, or data, remove them manually:
# docker volume rm <VOLUME_ID>
Replace
<VOLUME_ID>with the volume name(s) you want to delete.
You can also perform steps 2 and 3 in a single command.
Warning
The -v flag will permanently delete all your Wazuh data, configurations, and logs. Use this only when you want to remove the deployment and start fresh completely.
Run the following to stop the stack and immediately remove all associated volumes:
# docker compose down -v